HD Stock Technicals Today: Gains 0.35%, Testing Support Level
On September 28, 2026: price 293.20 USD, trend downtrend, RSI 30.8, support 292.18, resistance 330.19. technical analysis of hd stock. HD Stock Technicals —…

Home Depot shares edged up to 293.20 USD on the NYSE, a modest 0.35% daily gain that does little to change the bigger picture: the stock is still trading in a clear corrective phase after a 10.78% slide over the past month, with the latest price sitting below both the SMA20 at 309.00 and the SMA50 at 327.22. As shown in the chart, that positioning matters more than the small bounce itself. It tells investors the market is still pricing in weakness, even if the latest session showed some buyers stepping back in.
Trend & Price Action
The trend remains defined by a downtrend, and the slope of the SMA20 at -2.98% over 5 days shows the short-term average is still rolling lower rather than flattening out. In plain English, that means recent prices have been falling fast enough to pull the trend line down with them. The absence of a fresh MA-cross also matters: there is no technical sign yet that short-term momentum has reclaimed control from the longer-term pressure represented by the SMA50.
The stock is trading near the lower end of its recent range, with the 3-month low at 291.07 close to the current level and the 3-month high at 358.85 still far overhead. That combination usually signals a market that is trying to stabilize, but has not yet proven it can reverse.
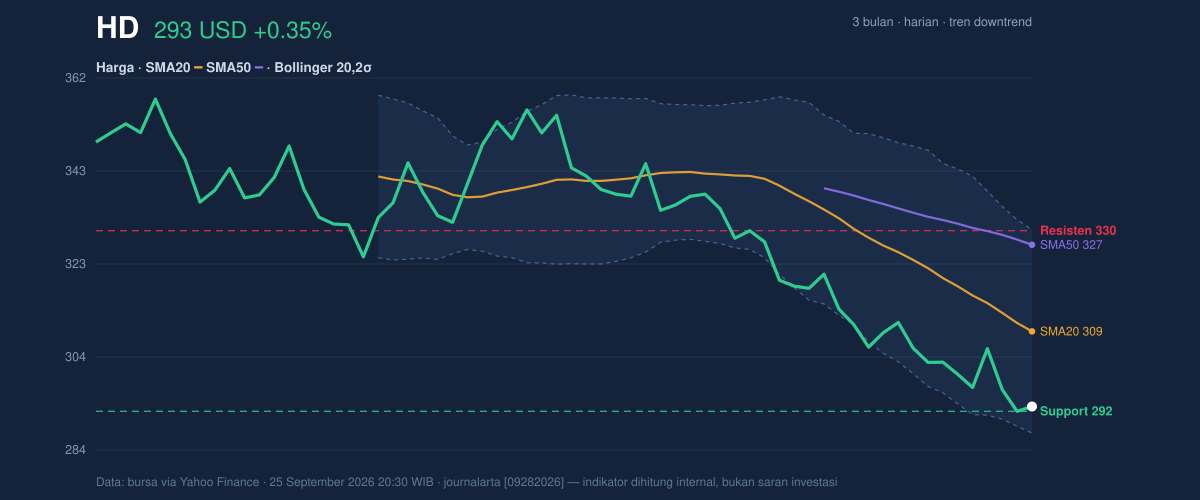
The most immediate reference point is the 20-hour support at 292.18, which is almost exactly where the shares last settled. That is a critical detail: when price hovers right on support, the market is essentially testing whether recent sellers have exhausted themselves. The 20-hour resistance at 330.19 and the Bollinger midline at 309.00 show the first and second hurdles if a rebound develops.
A small bounce is not the same as a trend change.
What matters is whether price can climb back above the middle band.
Oscillators & Momentum
The oscillator picture is mixed, but not in a reassuring way. The RSI(14) at 30.8 is technically near the oversold zone, yet still described as neutral in the data set, which suggests the stock has lost momentum without necessarily reaching a strong reversal signal. That usually means the market is tired, but not automatically ready to turn.
By contrast, the Stochastic %K at 7.0 and %D at 5.2 are both deeply oversold. Stochastic measures where price sits within its recent range, so readings this low often reflect a stock that has been sold aggressively and may be vulnerable to a reflex bounce. But oversold can stay oversold in a downtrend.
The MACD at -10.039, still below the signal line at -9.254, keeps the momentum signal negative, and the -0.785 histogram confirms that downside pressure remains in place. As shown in the chart, the oscillators are not yet aligned in a clean reversal pattern: Stochastic is stretched, but MACD still says the trend has not turned.
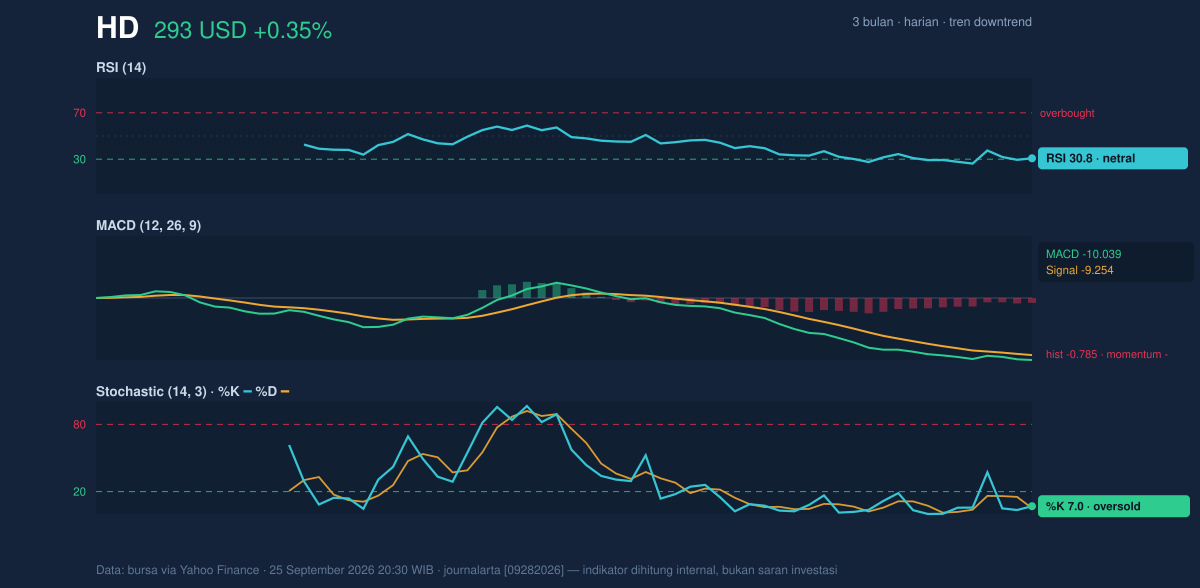
That is the key tension in the name right now: short-term exhaustion is visible, but trend confirmation is missing.
Volatility & Volume
Bollinger Bands help frame how far the stock has traveled from its recent average. The price is near the lower band at 287.59, with %B at 13%, meaning it is sitting very close to the bottom of the recent volatility envelope. In practical terms, the market is pricing Home Depot near the lower edge of its normal range, which often attracts attention from short-term traders looking for mean reversion — a move back toward the average — but only if the price stops making fresh lows.
The band width of 13.9% is described as normal, so this is not a volatility squeeze that usually precedes a dramatic breakout. Instead, the ATR(14) at 6.66, equal to 2.3% of price, indicates moderate daily movement. That means the stock can still swing enough to matter, but not in a disorderly way.
Volume adds a useful confirmation: the latest reading of 5,968,600 shares is about 1.3× the 20-day average of 4,500,435, which suggests the latest move is being met with above-normal participation. Yet the OBV is falling, and that is the more important clue. On-balance volume tracks whether trading flow is accumulating or distributing the stock over time; a declining OBV means the broader volume trend still favors sellers, even if one session shows heavier activity.
Key Levels & Scenarios
The technical map is straightforward. The first line to watch is 292.18 support. If that level fails to hold, the next area of interest is the 287.59 lower Bollinger band, which sits just beneath the current price and could act as a final short-term cushion. On the upside, the first meaningful recovery marker is the 309.00 Bollinger middle band and SMA20, followed by the 330.19 resistance zone and then the 330.40 upper band.
If the stock reclaims the middle band, it would suggest sellers are losing control of the short-term trend. If it cannot, the market remains in a weak posture.
Technical Verdict: HOLD (wait & see)
HOLD (wait & see)
- Trend remains negative: price is below the SMA20 at 309.00 and SMA50 at 327.22, with the SMA20 slope still falling.
- Momentum is split: Stochastic is oversold, but MACD stays negative, so there is no clean reversal confirmation yet.
- Volume confirms interest, not recovery: turnover is above average, but OBV is still declining, which keeps the burden on buyers.
Verdict invalidated if price breaks below 287.59 and fails to recover quickly.
- Ideal Entry Range: 287.59 to 292.18
- Exit Target: 309.00, then 330.19 to 330.40
- Stop Loss protection: below 287.59
In plain English: the stock looks stretched enough for a bounce, but not strong enough yet to call a real turn.
Summary Data HD
| Last price | 293.20 USD |
| Change 1 day / 5 days / 1 month | 0.35% / -2.26% / -10.78% |
| Trend / MA-cross | downtrend / none |
| SMA20 / SMA50 | 309.00 / 327.22 |
| RSI (14) / Stochastic %K | 30.8 / 7.0 |
| Bollinger %B / ATR | 13% / 6.66 |
| Support / Resistance 20 days | 292.18 / 330.19 |
| Data as of | 25 September 2026 20:30 WIB |

