UNH Stock Gains 0.42% Today, Testing Support Level
On September 28, 2026: price 376.59 USD, trend downtrend, RSI 39.6, support 371.29, resistance 400.94. technical analysis of unh stock.

UnitedHealth Group shares on the NYSE edged up to US$376.59 on 25 September 2026, but the move still leaves the stock below its short- and medium-term trend lines, a sign that buyers have not yet taken control of the tape.
Trend & Price Action
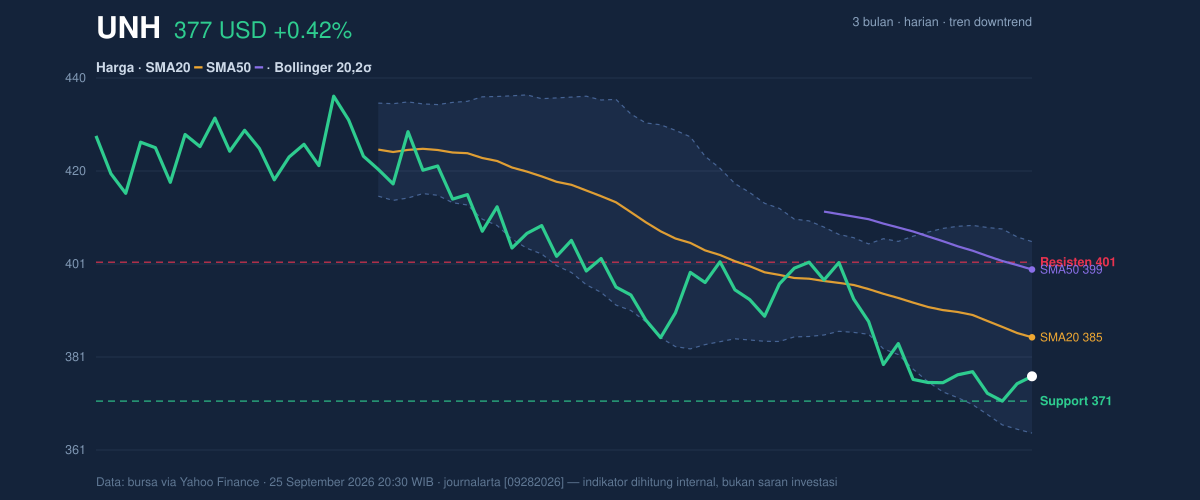
The headline number matters because it sits just above the recent low end of the trading range, not near the centre of it. As shown in the chart, UNH is trading below its SMA20 at US$384.90 and well under its SMA50 at US$399.38, which keeps the price structure in a downtrend. The SMA20 slope is falling at -1.39% over 5 days, so the short-term average is still leaning lower rather than flattening out.
That matters more than the one-day gain of 0.42%. A single positive session can be noise; a declining moving average says the recent path of least resistance is still downward. The stock is also only 18% of the way through its 20-day range, with support at US$371.29 and resistance at US$400.94. In plain terms, UNH is closer to the floor than the ceiling, but not yet at a level that would confirm a durable bounce.
The broader three-month range adds context. The share price is far below the 3-month high of US$461.62 and only modestly above the 3-month low of US$366.00. That positioning suggests the market has already repriced the stock lower, and the burden is now on buyers to prove that the recent weakness is exhaustion rather than the start of a deeper reset.
Oscillators & Momentum
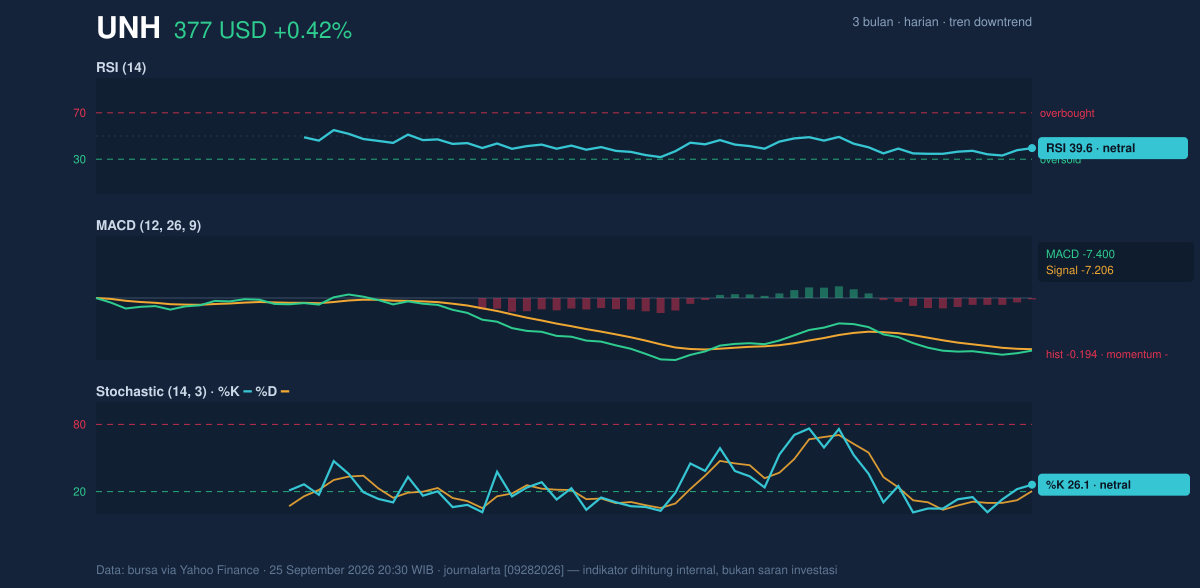
As shown in the chart, the momentum tools are not flashing panic, but they are not giving a clean bullish signal either. The RSI at 39.6 is technically neutral, yet it sits below the midpoint that often separates constructive momentum from weakening momentum. That tells readers the stock is not oversold enough to imply an automatic rebound, but it is also not stretched enough to suggest an overheated advance.
The Stochastic %K at 26.1 and %D at 20.5 are also neutral, though the pair is hovering near the lower end of the scale. For non-specialists, stochastic measures where price sits within its recent range; readings near the bottom can hint at selling pressure easing, but only if price starts to turn up. Right now, the indicator is more consistent with a stock that is trying to stabilise than one already in recovery.
The clearest signal comes from MACD. The MACD at -7.400 is below the signal line at -7.206, with a negative histogram of -0.194. That combination means downside momentum is still slightly stronger than the recent average pace of price movement. In practical terms, the stock may be losing altitude more slowly, but it has not yet crossed into a confirmed momentum turn.
Volatility & Volume
Bollinger Bands help frame how stretched the stock is relative to its own recent history. UNH is sitting below the middle band at US$384.90, with the upper band at US$405.33 and lower band at US$364.46. The %B of 30% places the price in the lower part of the band structure, which usually signals weakness rather than strength, but not extreme weakness. The 10.6% band width is normal, so this is not a volatility breakout setup yet; it is more of a steady drift within a defined envelope.
ATR, or average true range, is US$9.99, about 2.7% of price. That points to moderate daily movement, enough for the stock to make meaningful swings, but not enough to imply panic conditions. For traders watching the chart, that means levels can still matter: if price pushes through support or resistance, the move is likely to be respected rather than instantly reversed.
Volume, however, is the most interesting cross-current. The latest volume of 4,077,400 is only about 0.8× the 20-day average of 5,117,875, so the rebound attempt is not being powered by broad participation. Yet OBV is rising, which suggests cumulative buying pressure has been improving even while headline volume remains subdued. That divergence can matter: it often means accumulation is happening quietly, but not forcefully enough to change the trend on its own.
Key Levels & Scenarios
The immediate line in the sand is US$371.29 support. If that level fails, the chart opens the door to a retest of the US$366.00 three-month low, which would reinforce the downtrend and keep pressure on the stock’s short-term structure. On the upside, US$384.90 is the first technical hurdle because it is both the SMA20 and the Bollinger middle band. A move back above that zone would signal that price is reclaiming the short-term trend framework.
Beyond that, US$399.38 at the SMA50 and US$400.94 resistance form the next ceiling. A push through that area would be more meaningful because it would place the stock back into the upper half of its recent range and start to repair the bearish structure. Until then, the chart remains a recovery attempt inside a broader weak trend.
Technical Verdict: HOLD (wait & see)
HOLD (wait & see) fits best because the stock is still below SMA20 at US$384.90 and SMA50 at US$399.38, MACD remains negative, and volume is running below normal even as OBV rises. That combination says the selling pressure may be easing, but the chart has not yet confirmed a trend reversal.
- Ideal Entry Range: US$371.29 to US$384.90, where support and the short-term average overlap.
- Exit Target: US$399.38 to US$400.94, the SMA50 and nearby resistance zone.
- Stop Loss protection: below US$366.00, because that would expose the recent three-month low area.
- Verdict invalidated if price breaks below US$366.00, as that would suggest the downtrend is still in control.
For non-traders: the stock looks like it is trying to stabilise, but it has not yet proved that the worst of the weakness is over.
Summary Data UNH
| Last price | 376.59 USD |
| Change 1 day / 5 days / 1 month | 0.42% / -0.08% / -4.67% |
| Trend / MA-cross | downtrend / none |
| SMA20 / SMA50 | 384.90 / 399.38 |
| RSI (14) / Stochastic %K | 39.6 / 26.1 |
| Bollinger %B / ATR | 30% / 9.99 |
| Support / Resistance 20 days | 371.29 / 400.94 |
| Data as of | 25 September 2026 20:30 WIB |

