DBS Stock Gains 0.35%, Testing Key Resistance In Focus
On September 30, 2026: price 78.38 SGD, trend uptrend, RSI 62.7, support 76.75, resistance 78.65. technical analysis of dbs stock. DBS Stock Gains — full…

DBS Group Holdings traded at SGD 78.38 on SGX, up 0.35% from the previous close of 78.11, and the stock is now sitting close to the top of its recent range. The message from the tape is not just that the share price is rising; it is that buyers have kept DBS above its short-term average while momentum tools are starting to disagree with one another, a pattern that often shows a mature advance rather than a fresh breakout. As shown in the chart, the stock is pressing against nearby resistance even as volatility compresses.
Trend & Price Action
DBS remains in an uptrend, with the SMA20 rising at 0.47% over 5 days and price holding above the SMA20 at 77.59 and the SMA50 at 76.21. That positioning matters because it shows the market is still willing to pay above the recent average, a sign of trend persistence rather than defensive trading. The absence of a fresh MA-cross means the move is being sustained by price strength, not a newly triggered crossover signal. In plain terms: the trend is already in place, and the question is whether it can keep extending without pausing.
The stock is also trading at 86% of its 20-hour range, with support at 76.75 and resistance at 78.65. That places DBS near the upper edge of its short-term band, where upside attempts often need stronger confirmation to continue. The broader 3-month range, from 65.30 to 79.05, shows how close the share is to the upper boundary of that period. The ceiling is not far away.
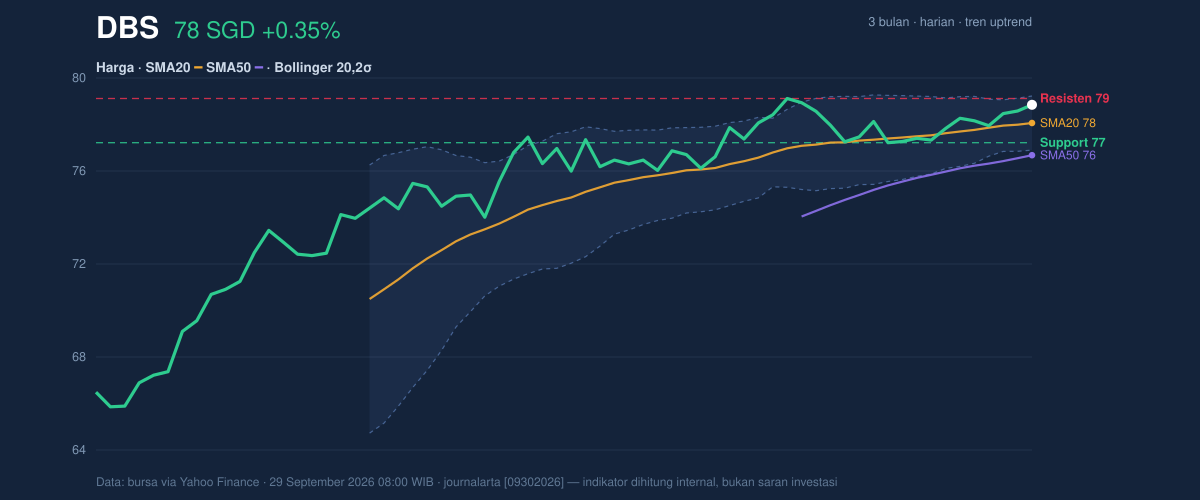
The Bollinger band structure reinforces that tension. Price is near the upper band at 78.76, with %B at 84%, which means the stock is trading in the upper part of its volatility envelope. Yet the band width is only 3.0%, described here as a squeeze. That combination is important: a stock can sit near the top of a narrow band when momentum is still intact, but the squeeze also warns that a larger move may be coming soon. The direction is not guaranteed; the setup is simply primed.
Oscillators & Momentum
The momentum picture is more mixed than the trend picture. RSI at 62.7 is still neutral, which means DBS is not yet in the classic overbought zone, but it is leaning high enough to show demand has been persistent. By contrast, Stochastic %K at 94.5 and %D at 86.5 are both overbought, a sign that the stock has advanced quickly within the recent range and may be vulnerable to short pauses or pullbacks. Stochastic is useful here because it reacts faster than RSI; when it runs hot while price is near resistance, it often signals that buyers are becoming a little stretched.
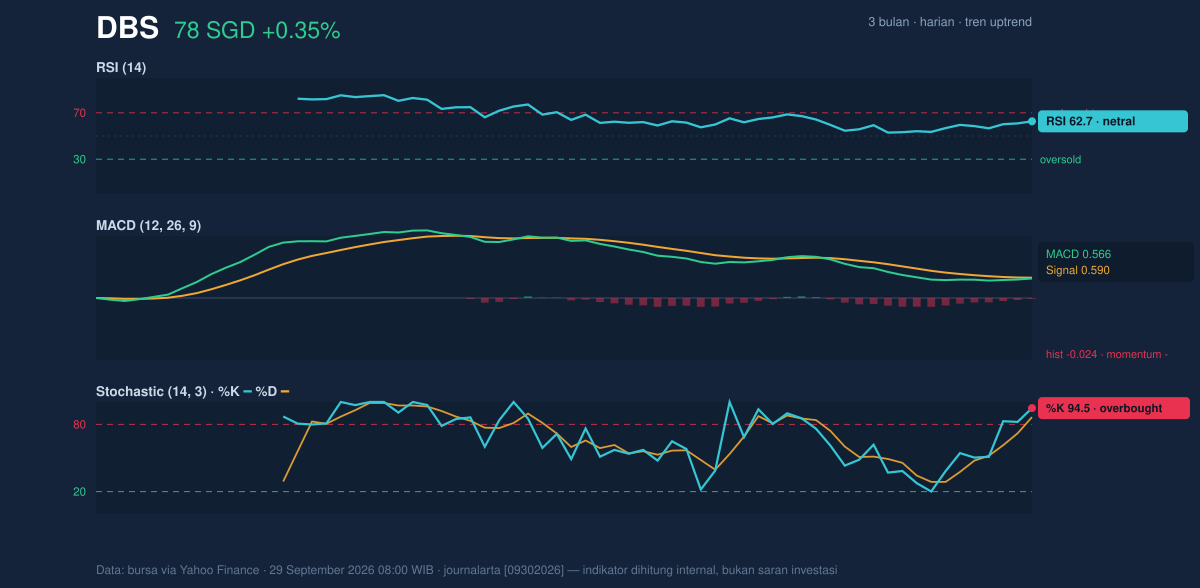
The more cautionary signal comes from MACD at 0.566, sitting below its signal line at 0.590, with a histogram of -0.024. That negative histogram means the short-term momentum impulse has weakened even though the price trend has not broken. Put simply, price is still rising, but the engine underneath is not accelerating as strongly as before. That is not a reversal by itself, but it is a warning that the move may need fresh volume or a clean breakout to keep going.
Volatility & Volume
Volatility is subdued. ATR at 0.90, or 1.1% of price, says DBS is not swinging wildly from session to session. Low ATR tends to mean the market is waiting for a catalyst or digesting prior gains. Combined with the 3.0% Bollinger squeeze, this suggests compression rather than turbulence. Compression rarely lasts forever; it usually resolves into expansion, but the chart does not yet tell us which way.
Participation, however, is constructive. Last volume was 4,565,300, above the 20-hour average of 3,492,012, or 1.3 times normal. That is important because rising prices on above-average turnover tend to be more credible than a drift higher on thin trade. OBV is rising, which means cumulative volume flow is still supporting the advance. In simple terms, more shares have been changing hands in a way that backs the uptrend rather than fading it.
The tension here is clear: volume is supportive, but momentum is not fully synchronized. That is often what a late-stage advance looks like before either a breakout or a cooling-off phase.
Key Levels & Scenarios
The immediate technical map is tight. Resistance at 78.65 is the first level to watch, with the upper Bollinger band at 78.76 just above it. A move through that zone would show DBS can absorb supply near the top of its short-term range and potentially shift from compression into expansion. On the downside, support at 76.75 sits above the SMA20 at 77.59? Actually the chart structure shows the moving average remains the main trend reference, while 76.75 is the more immediate floor from recent trading. If price slips back through that area, the market would likely be signaling that the squeeze is resolving lower rather than higher.
The wider context is still constructive because the stock is far above the SMA50 at 76.21 and well above the 3-month low of 65.30. But the near-term setup is no longer one of easy upside. It is one of compression near resistance, with momentum starting to soften.
Technical Verdict: HOLD (wait & see)
HOLD (wait & see)
- Trend remains positive: price is above the SMA20 at 77.59 and SMA50 at 76.21, with the SMA20 still sloping upward.
- Momentum is mixed: Stochastic is overbought and MACD histogram is negative, which argues for caution near resistance.
- Participation is supportive: volume is running at 1.3 times normal and OBV is rising, so the uptrend has backing, but not yet a clean acceleration signal.
Verdict invalidated if price falls below 76.75, which would weaken the short-term structure and suggest the squeeze is resolving downward.
- Ideal entry range: 76.75 to 77.59
- Exit target: 78.65 to 78.76
- Stop loss protection: below 76.75
For non-traders, this means DBS is still trending higher, but the stock is close enough to resistance that the next move matters more than the current drift.
“The market is still paying up for DBS, but it is also asking for proof.”
Summary Data DBS
| Last price | 78.38 SGD |
| Change 1 day / 5 days / 1 month | 0.35% / 0.75% / 1.91% |
| Trend / MA-cross | uptrend / none |
| SMA20 / SMA50 | 77.59 / 76.21 |
| RSI (14) / Stochastic %K | 62.7 / 94.5 |
| Bollinger %B / ATR | 84% / 0.90 |
| Support / Resistance 20 days | 76.75 / 78.65 |
| Data as of | 29 September 2026 08:00 WIB |


