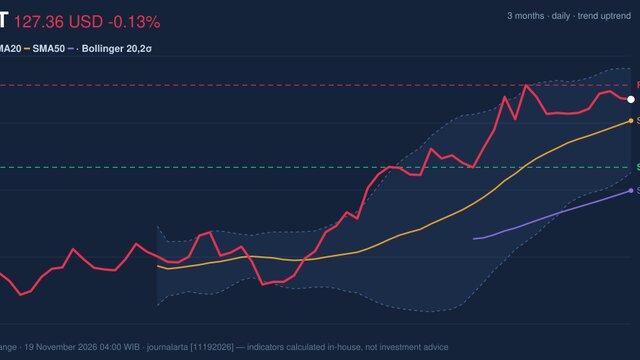
Exelon (EXC) Stock Update: Rises 0.35%, Up 6.9% in a Month
Technical analysis of EXC stock on November 18, 2026: price 46.02 USD, trend uptrend, RSI 59.9, support 44.43, resistance 46.53.

Why EXC is in focus today
Selected automatically from 11 NASDAQ (US) stocks by a technical-signal score with daily weighted randomisation — not a recommendation.
Trend & Price Action
The stock sits at 46.02 USD, above its 20-day average of 45.64 and comfortably above its 50-day average of 43.36, which is the textbook definition of a stock in an uptrend rather than a bounce. The 20-day average itself has been climbing, rising 1.76% over the past five days, so the floor beneath the price is moving up, not flattening. There is no fresh moving-average cross in the data — the golden-cross setup of the 20-day above the 50-day is already established, and the market is now trading the consequences rather than the signal. The price sits at roughly 76% of its 20-day range, with support at 44.43 and resistance at 46.53. That is a stock pressing toward the top of its recent band without having broken out. The three-month high of 47.09 is the real ceiling to watch; the three-month low of 39.73 shows how far the recovery has run.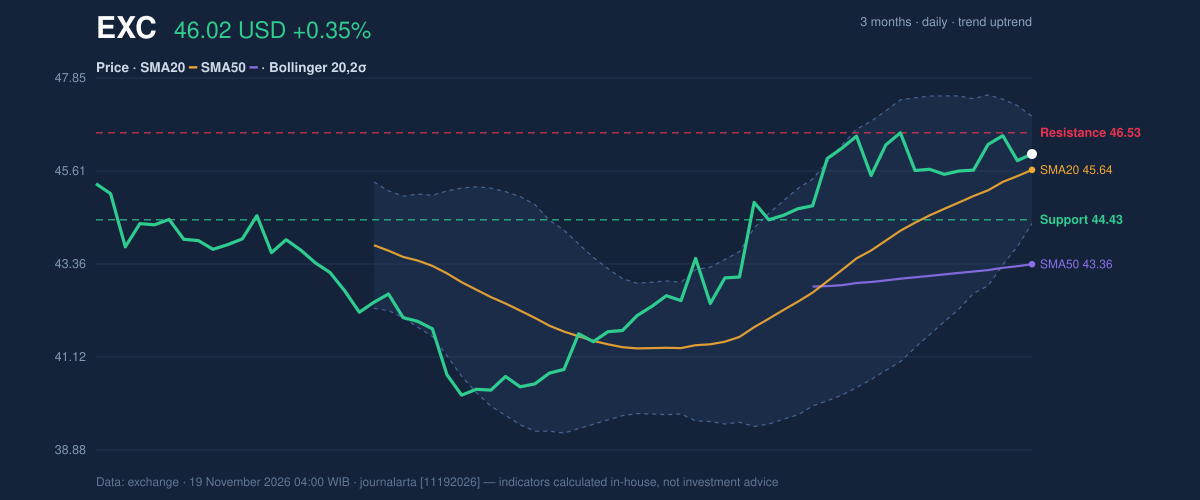
Oscillators & Momentum
Momentum is where the picture gets less comfortable. The RSI(14) is 59.9 — neutral, but just below the 65-70 zone where it has recently started to roll over. The Stochastic is also neutral, with %K at 47.5 against %D at 54.6, meaning the fast line sits below the slow line and short-term momentum is drifting rather than accelerating. The MACD tells the same story: the line at 0.741 is below its signal at 0.814, with a histogram of −0.074. That is a negative momentum reading inside a positive trend — a cooling pattern, not a reversal signal. In plain terms, buyers are still in control of the bigger picture, but they are not adding with urgency.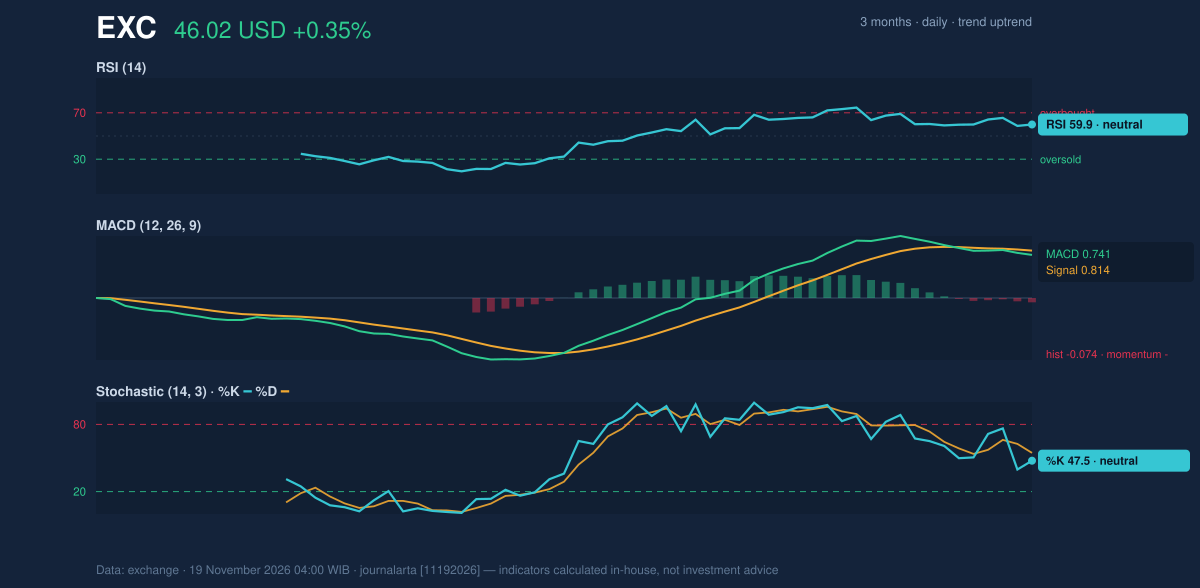
Volatility & Volume
Volatility is compressed. The Bollinger band width is 5.7%, with the upper band at 46.93 and the lower at 44.34, and the price sits at 65% of the band range — the so-called %B reading. A narrowing band after a sustained move is a squeeze, and squeezes resolve in expansion. The direction is not preordained, but the trend context leans upward. The ATR(14) of 0.87 equals about 1.9% of the price, which is moderate for a large-cap utility and consistent with a stock that is not being repriced violently in either direction. Volume is the softer part of the story. The last session traded 5,969,400 shares, just 0.7× the 20-day average of 8,809,895 — thin participation. Yet On-Balance Volume is rising, meaning the cumulative volume flow still favors buyers despite the light tape. Thin volume during a consolidation is normal; thin volume on a breakout would be the thing to question.Key Levels & Scenarios
The levels are tightly packed and easy to read. On the upside, 46.53 is the immediate resistance and 47.09 the three-month high; a daily close above the former, ideally with volume back toward the 8.8 million-share average, would confirm the squeeze resolving higher. On the downside, 44.43 is the 20-day support and the lower Bollinger band at 44.34 sits just beneath it — a confluence zone. Below that, the 50-day average at 43.36 is the trend's last line of defence. The reward-to-risk math from the JournalArta signals frames it cleanly: an entry zone of 45.37 to 46.02, a first target at 48.67, a second at 51.33, and a stop at 44.25.Technical Verdict: BUY
The verdict is BUY, backed by a computed score of +76 on a −100 to +100 scale, where +60 is the buy threshold. Three reasons carry it: the price is above its 50-day average at 43.36, the 20-day average sits above the 50-day and has been rising, and the RSI at 59.9 is in the healthy 50-70 zone rather than overbought territory. The rising OBV confirms that participation, even if light, is accumulating on the bid. The risk is explicit: the MACD histogram at −0.074 and the RSI rolling over from above 65 mean momentum can keep fading before it re-accelerates. The verdict is invalidated if price breaks and closes below 44.25. - Entry Range: 45.37 – 46.02 - Exit Target 1: 48.67 - Exit Target 2: 51.33 - Stop Loss: 44.25 - Reward/Risk: 1.5 / 3.0 · valid until 17 December 2026 In plain English: the trend is up and the pullback has held, so the setup favours buyers, but the flat momentum says patience is part of the trade. This is technical analysis, not investment advice. As one desk strategist put it, "the squeeze is the message — the market is deciding whether Exelon's next move is a breakout or a sigh, and the volume on the next session will tell us which."Summary Data EXC
| Last price | 46.02 USD |
| Change 1 day / 5 days / 1 month | 0.35% / 0.90% / 6.90% |
| Trend / MA-cross | uptrend / none |
| SMA20 / SMA50 | 45.64 / 43.36 |
| RSI (14) / Stochastic %K | 59.9 / 47.5 |
| Bollinger %B / ATR | 65% / 0.87 |
| Support / Resistance 20 days | 44.43 / 46.53 |
| Data as of | 19 November 2026 04:00 WIB |
| JournalArta research verdict (score) | Buy (+76) |
| Entry zone | 45.37 – 46.02 |
| Target 1 / 2 | 48.67 / 51.33 |
| Stop loss | 44.25 |
| Reward/risk | 1.5 / 3.0 |
Today's full Buy and Sell list for US stocks →
Disclaimer: This technical analysis is generated automatically from exchange data and indicators calculated by JournalArta, for information and education only. The verdict and the entry, target and stop-loss levels are not investment advice or a solicitation to buy or sell any security. Investment decisions and their risks rest solely with the reader.
Track EXC stock price daily: live levels, support/resistance and our full EXC analysis history.
 Take the quizWhat Kind of Holiday Spender Are You? Take the Black Friday QuizStart →
- 1Gold Silver Price November: Futures Rise Near Yearly Lows

- 2U.S. Emergency Alert Test Nov. 17 Is Not a Power Outage

- 3Michael Clarke Says Sandpapergate Scars Drew Steve Smith to New York

- 42027 NFL Mock Draft Puts Ohio State’s Jeremiah Smith at No. 1

- 5Brent Crude Slides 4.05% as Rising US Stockpiles Weigh on Oil
 Lifestyle · Food & HealthWhat Is Raynaud’s Syndrome? Why Fingers Turn White in the Cold
 Lifestyle · Food & Health4 Ways Walking After Meals Helps Your Body, Doctors Say
 Lifestyle · Food & Health4 Reasons to Eat Oatmeal, According to Nutrition Experts
 Lifestyle7 Signs Your Social Battery Is Running Low (and Why You Keep Cancelling Plans)