Simon Property (SPG) Stock Rises 0.50%: Up 12.6% in a Month
Technical analysis of SPG stock on November 18, 2026: price 231.38 USD, trend uptrend, RSI 68.6, support 211.24, resistance 234.75.

Why SPG is in focus today
Selected automatically from 11 NYSE (US) stocks by a technical-signal score with daily weighted randomisation — not a recommendation.
Trend & Price Action
The structure is a textbook higher-low sequence: the 50-day average at $211.51 sits almost exactly on 20-day support at $211.24, so any deeper test would find a double floor rather than a single line. The 20-day average's upward slope tells you the short-term trend is still rising even after the recent five-session dip — the dip is a pause, not a reversal. The key overhead test is the $234.75 resistance, just below the three-month high of $237.27; a close above it would confirm the uptrend's next leg, while failure to hold the $211 area would undercut the setup.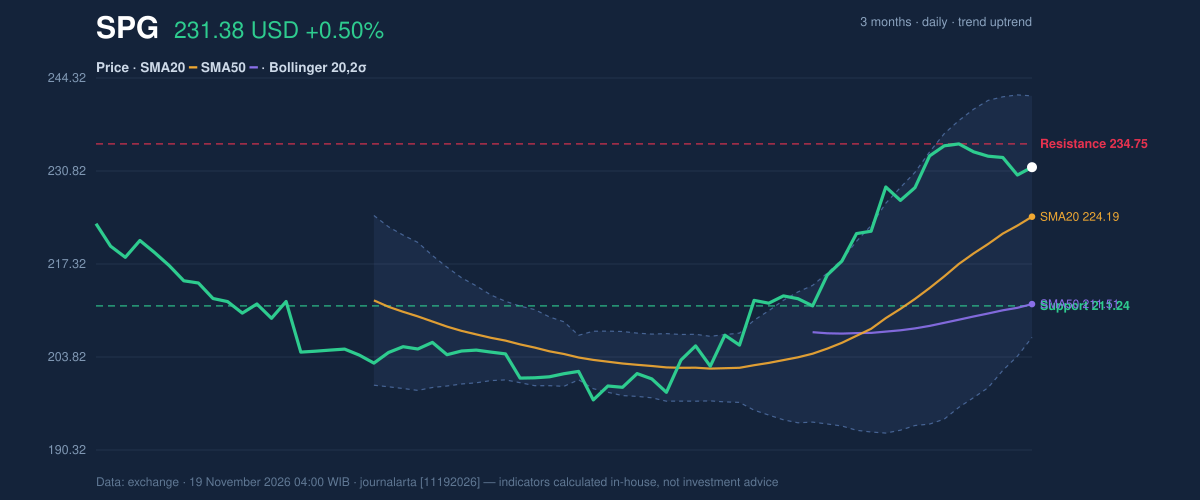
Bollinger positioning reinforces the constructive read. With the middle band at $224.19 — the same 20-day average — the price sits at 71% of the band width (%B), in the upper half but not pinned to the top band at $241.72. Band width of 15.6% is normal, meaning volatility is neither compressed into a squeeze nor expanding violently. That combination argues for continued orderly drift rather than a breakout spike or a breakdown.
Oscillators & Momentum
Momentum is positive but not stretched. The RSI(14) at 68.6 is in neutral territory, stopping just short of the 70 overbought threshold — a level that leaves room for further upside without signaling exhaustion. The Stochastic reads %K 73.1 against %D 75.5, also neutral, with the faster line slightly below the slower one — a mild short-term cooling rather than a bearish cross. Most importantly, MACD at 6.577 sits above its signal line at 6.385, with a positive histogram of 0.193, confirming that medium-term momentum still favors the bulls.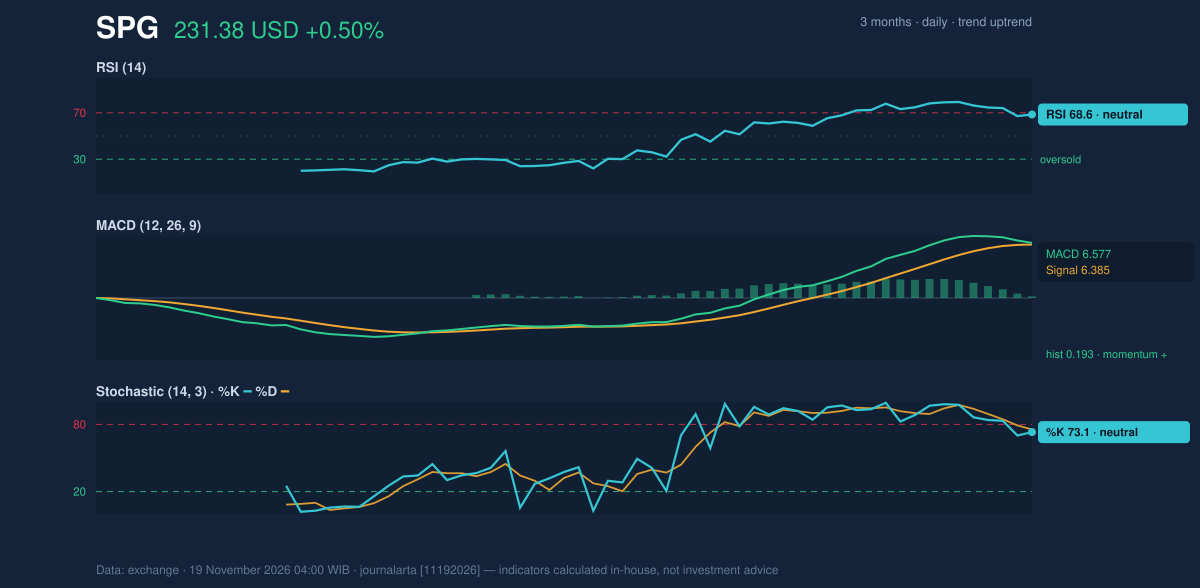
That alignment — trend, RSI and MACD all pointing the same way without overbought extremes — is the cleanest configuration a technical reader can ask for. The one caveat is the Stochastic hovering in the upper-neutral zone; a push above 80 would flag short-term fatigue, but at 73 it does not.
Volatility & Volume
ATR(14) at $4.59 equals 2.0% of the price, describing moderate volatility — daily swings of roughly $4-5 are normal, so a single red session should not be over-read. Volume at 1.0× average and a rising OBV confirm participation is steady and accumulation is ongoing, with no distribution divergence. Thin participation would have weakened the uptrend's credibility; here it does not.Fundamental Context
The technical picture is backed by reported results. Simon Property Group posted quarterly revenue of $1.81 billion for the quarter ended September 30, 2026, up 13.3% from $1.60 billion a year earlier, according to its SEC filing. Net income was $499.0 million, or $1.54 per diluted share, down from $606.2 million a year earlier — a contrast that explains why the stock's advance has been orderly rather than explosive. The company also filed a Form 8-K on November 5, 2026, reporting its results and a Regulation FD disclosure. Revenue growth supports the trend; the earnings decline is the fundamental risk the technicals have not yet priced in.Technical Verdict: BUY
The verdict is BUY, backed by three signals: price above its 50-day average at $211.51, the 20-day average above the 50-day, and a confirmed uptrend with a rising OBV and positive MACD. The score of +66 on the −100 to +100 scale clears the +60 buy threshold, with no bearish signals on the other side. The invalidation condition is a close below $223.55, which would break the stop level and undermine the setup. - Entry Range: $227.93 – $231.38 - Exit Target 1: $243.12 - Exit Target 2: $254.87 - Stop Loss: $223.55 - Reward/Risk: 1.5 / 3.0 — valid until December 17, 2026 In plain terms: the trend is intact, momentum is positive without being overheated, and the stock is holding its ground — but the setup is only as good as the $223.55 floor beneath it.Summary Data SPG
| Last price | 231.38 USD |
| Change 1 day / 5 days / 1 month | 0.50% / -1.44% / 12.57% |
| Trend / MA-cross | uptrend / none |
| SMA20 / SMA50 | 224.19 / 211.51 |
| RSI (14) / Stochastic %K | 68.6 / 73.1 |
| Bollinger %B / ATR | 71% / 4.59 |
| Support / Resistance 20 days | 211.24 / 234.75 |
| Data as of | 19 November 2026 04:00 WIB |
| JournalArta research verdict (score) | Buy (+66) |
| Entry zone | 227.93 – 231.38 |
| Target 1 / 2 | 243.12 / 254.87 |
| Stop loss | 223.55 |
| Reward/risk | 1.5 / 3.0 |
Today's full Buy and Sell list for US stocks →
Disclaimer: This technical analysis is generated automatically from exchange data and indicators calculated by JournalArta, for information and education only. The verdict and the entry, target and stop-loss levels are not investment advice or a solicitation to buy or sell any security. Investment decisions and their risks rest solely with the reader.
 Take the quizWhat Kind of Holiday Spender Are You? Take the Black Friday QuizStart →
Most Read





Don't Miss
 Lifestyle · Food & HealthNormal Blood Pressure Chart by Age: Healthy Ranges Explained
 Lifestyle · Food & HealthWhat Is Raynaud’s Syndrome? Why Fingers Turn White in the Cold
 Lifestyle · Food & Health4 Ways Walking After Meals Helps Your Body, Doctors Say
 Lifestyle · Food & Health4 Reasons to Eat Oatmeal, According to Nutrition Experts