Berkshire Hathaway Stock Update: Slides 2.07%, Down 2.3% in Five Sessions
Technical analysis of Berkshire Hathaway stock on November 18, 2026: price 574.62 USD, trend uptrend, RSI 60.8, support 540.34, resistance 592.94.

Why Berkshire Hathaway is in focus today
- One-day move of 0.00%, about 0.0× its average daily range (ATR)
Selected automatically from 11 NYSE (US) stocks by a technical-signal score with daily weighted randomisation — not a recommendation.
Trend & Price Action
The structural trend remains constructive. The last price of 574.62 USD is above the 20-day average at 566.24 USD, which in turn sits above the 50-day average at 534.37 USD — the classic stacking of a sustained advance. The 20-day average itself has been rising, gaining 2.43% over the past five days, which is the slope of the average, not the stock’s price change. No new moving-average crossover has formed, so this is a trend in progress rather than a fresh signal. The pullback has parked the stock at roughly 65% of its 20-day range between support at 540.34 USD and resistance at 592.94 USD. That is the middle-to-upper part of the range, a zone where buyers have historically defended dips in an uptrend. The working bullish signal flagged by the data is precisely this: a pullback to the 20-day average within an uptrend, with price still above the 50-day line.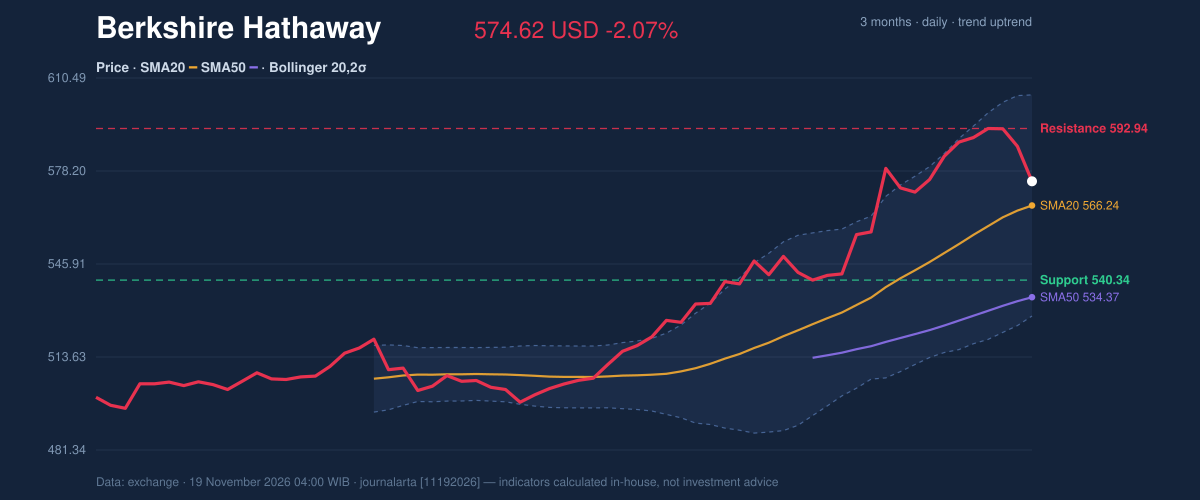
Oscillators & Momentum
Momentum is where the caution emanates. The RSI(14) at 60.8 remains in neutral territory, but the data shows it rolling over from above 65 — a tell that buying pressure is easing rather than reversing. The stochastic is split: %K at 59.2 against %D at 77.9, with the faster line below the slower one, a configuration that typically precedes further consolidation. The MACD makes the same point more starkly. The line at 16.050 sits just below its signal at 16.079, and the histogram has just turned negative at −0.030. The gap is tiny, but the direction of travel is what counts: this is the first loss of momentum in the current leg. Of the seven technical signals on each side, the code finds only one bullish — the pullback to the 20-day average — against two bearish: the RSI rollover and the negative MACD histogram.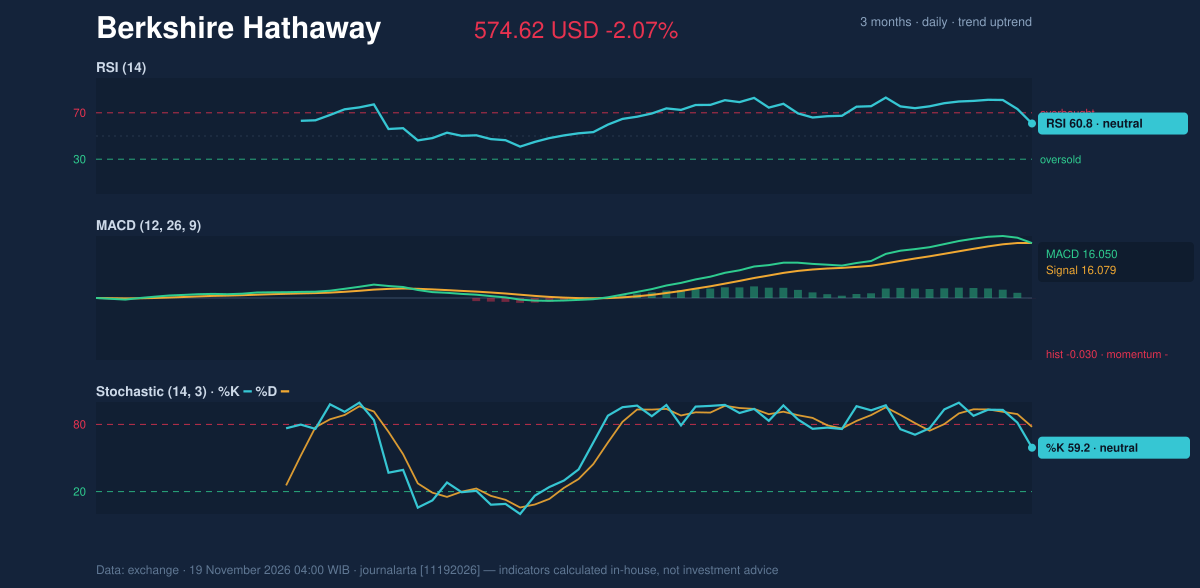
Volatility & Volume
Volatility is moderate. The ATR(14) at 11.92 USD equals 2.1% of the price, so a 2.07% down day is roughly one average day’s range — not a shock, just a normal-sized move. The Bollinger bands (20, 2σ) run from 527.86 USD to 604.62 USD, a width of 13.6%, which the data classifies as normal rather than a squeeze. The stock sits at 61% of the band range (%B), meaning it is above the middle band but well short of the upper band — room to move in either direction without a mechanical trigger. Volume offers the least comfort. The last session traded 5,420,000 shares against a 20-day average of 5,205,665, a ratio of 1.0× — ordinary participation. There is no capitulation and no accumulation. The on-balance volume line is falling, however, which means the modest selling has been persistent enough to erode cumulative volume support. Thin confirmation, in other words, rather than a conviction signal either way.Fundamental Context
The pullback is not being driven by the earnings tape. According to its SEC filing, Berkshire reported quarterly revenue of $74.32 billion for the quarter ended September 30, 2026, up 16.6% from $63.75 billion a year earlier. Net income came in at $22.11 billion, compared with $30.80 billion a year earlier. The company also filed a Form 8-K on November 9, 2026 reporting its results of operations and financial condition. Revenue growth with lower net income points to a mix shift rather than deterioration — and none of it alters the technical setup, which remains the deciding factor here.Key Levels & Scenarios
Two levels frame the next move. On the upside, resistance at 592.94 USD — reinforced by the 596.92 USD three-month high — must be cleared on a closing basis before the uptrend can resume toward the upper Bollinger band at 604.62 USD. On the downside, support at 540.34 USD is the line that matters; a close below it would break the 20-day structure and put the 50-day average at 534.37 USD into play. The reference levels computed from volatility sit at 556.74 USD (price minus 1.5×ATR) and 592.50 USD (price plus 1.5×ATR), bracketing the likely trading envelope.Technical Verdict: HOLD (wait & see)
The verdict is HOLD, with a JournalArta research score of +50 on a −100 to +100 scale — below the +60 threshold required for a buy call. Three reasons carry the decision. First, the trend is intact: price above the 50-day average at 534.37 USD, the 20-day average above the 50-day, and the 20-day average rising 2.43% over five days. Second, momentum has stopped confirming: RSI at 60.8 rolling over from above 65 and a MACD histogram that has just turned negative. Third, the setup is early-stage near support rather than at a confirmed breakout, with only one bullish signal against two bearish. - Entry range (upside scenario): a close above the 20-day resistance at 592.94 USD, with confirmation against the 596.92 USD three-month high. - Exit target: the upper Bollinger band at 604.62 USD in the event of a confirmed breakout. - Stop loss: a close below the 20-day support at 540.34 USD invalidates the bullish structure; volatility-based protection sits at 556.74 USD (price minus 1.5×ATR). - Invalidation: the verdict is invalidated if price breaks below 540.34 USD, which would also threaten the 50-day average at 534.37 USD. In plain English: the long-term trend is still up, but the short-term engines have cooled, so the prudent stance is to wait for either a confirmed break above 592.94 USD or a clean hold of 540.34 USD before acting. The most recent hard number on the tape is the 574.62 USD close, 2.07% below the prior session and 18.30 USD under the 20-day resistance that now defines the breakout test.Summary Data Berkshire Hathaway
| Last price | 574.62 USD |
| Change 1 day / 5 days / 1 month | -2.07% / -2.32% / 6.61% |
| Trend / MA-cross | uptrend / none |
| SMA20 / SMA50 | 566.24 / 534.37 |
| RSI (14) / Stochastic %K | 60.8 / 59.2 |
| Bollinger %B / ATR | 61% / 11.92 |
| Support / Resistance 20 days | 540.34 / 592.94 |
| Data as of | 19 November 2026 04:00 WIB |
| JournalArta research verdict (score) | Hold (+50) |
Today's full Buy and Sell list for US stocks →
Disclaimer: This technical analysis is generated automatically from exchange data and indicators calculated by JournalArta, for information and education only. The verdict and the entry, target and stop-loss levels are not investment advice or a solicitation to buy or sell any security. Investment decisions and their risks rest solely with the reader.
Track Berkshire Hathaway stock price daily: live levels, support/resistance and our full Berkshire Hathaway analysis history.
 Take the quizWhat Kind of Holiday Spender Are You? Take the Black Friday QuizStart →
- 1Gold Silver Price November: Futures Rise Near Yearly Lows

- 2U.S. Emergency Alert Test Nov. 17 Is Not a Power Outage

- 3Michael Clarke Says Sandpapergate Scars Drew Steve Smith to New York

- 42027 NFL Mock Draft Puts Ohio State’s Jeremiah Smith at No. 1

- 5Brent Crude Slides 4.05% as Rising US Stockpiles Weigh on Oil
 Lifestyle · Food & HealthWhat Is Raynaud’s Syndrome? Why Fingers Turn White in the Cold
 Lifestyle · Food & Health4 Ways Walking After Meals Helps Your Body, Doctors Say
 Lifestyle · Food & Health4 Reasons to Eat Oatmeal, According to Nutrition Experts
 Lifestyle7 Signs Your Social Battery Is Running Low (and Why You Keep Cancelling Plans)