Apple (AAPL) Stock on Wednesday: Rises 0.15%, Up 2.5% in a Month
Technical analysis of AAPL stock on November 18, 2026: price 352.45 USD, trend uptrend, RSI 56.6, support 331.90, resistance 356.27.

Why AAPL is in focus today
Selected automatically from 11 NASDAQ (US) stocks by a technical-signal score with daily weighted randomisation — not a recommendation.
Trend & Price Action
The structural picture is bullish but becalmed. Apple trades above both its 20-day simple moving average of $347.69 and its 50-day average of $341.15, and the 20-day average itself climbed 0.82% over the past five sessions — a quiet but persistent upward tilt. No new moving-average cross has formed, meaning the last one embedded itself well before the latest session rather than firing fresh today. Over the past month the stock added 2.46%, though it slipped 0.89% across the last five sessions, a soft patch that has done little to dent the broader uptrend. Position within the range is the tell. At $352.45, Apple sits at 84% of its 20-day range, with support at $331.90 and resistance at $356.27. It is also trading in the upper reaches of its three-month band of $307.01 to $360.83 — close to the highs but not yet pushing through them.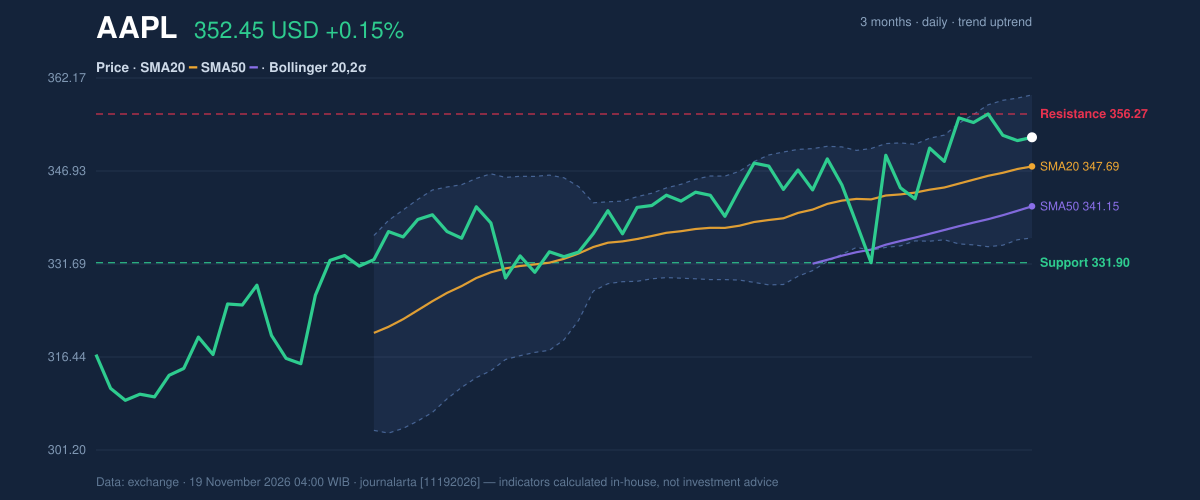
Oscillators & Momentum
Momentum is mildly constructive rather than charging. The RSI(14) reads 56.6 — squarely in neutral territory, with room to run before the 70 overbought threshold. Stochastic is more telling: %K at 76.4 and %D at 76.2, nearly fused, indicating the stock has climbed without triggering an exhaustion signal. The MACD is the more encouraging indicator, printing 3.897 against a signal line of 3.597, for a positive histogram of 0.300 — in plain terms, the momentum gauge has its foot lightly on the accelerator.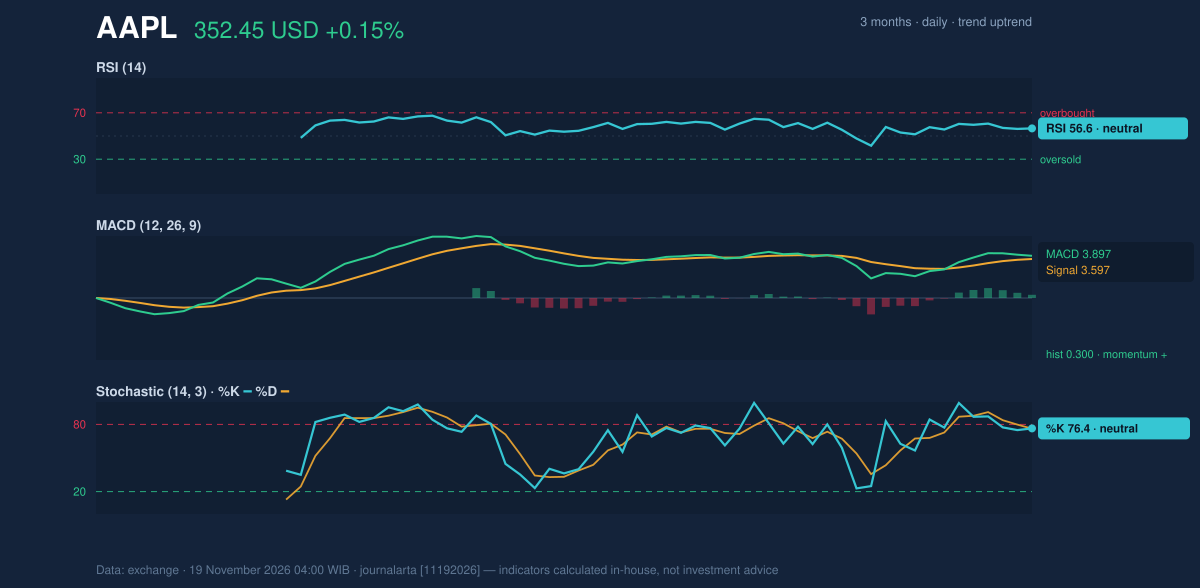
Volatility & Volume
Volatility is middling. The ATR(14) of 9.44 represents 2.7% of the price — enough daily swing to matter, but not the kind of turbulence that accompanies a breakdown or a blowoff top. Combined with the squeeze, this suggests any breakout could arrive with force once triggered. Volume is the one soft spot. The latest session traded 34.09 million shares against a 20-day average of 47.99 million — roughly 0.7× normal, or a notably thin tape. The On-Balance Volume line is falling, a reminder that quiet price gains have not been matched by broad participation. Thin volume during a squeeze cuts both ways: it makes a genuine breakout easier to ignite, but it also makes a false move easier to stage.Fundamentals in Context
The technical story has a fundamental backdrop. According to its SEC filing, Apple reported annual revenue of $478.83 billion for the fiscal year ended September 26, 2026, up 15.1% from $416.16 billion a year earlier. Net income reached $132.18 billion versus $112.01 billion, with diluted earnings per share of $8.98 — a Form 10-K filed November 3. A separate Form 8-K filed November 9 reported other material events. Fundamentals do not set the near-term direction here, but they underpin the uptrend the chart is tracing.Key Levels & Scenarios
The reference points are clear. On the upside, resistance at $356.27 is the first hurdle, with the three-month high of $360.83 just beyond. A decisive break above $356.27 would validate the squeeze resolution and open the path consistent with the chart's structure. On the downside, the 20-day average at $347.69 is the near-term floor, followed by support at $331.90. The stock's 84% position in its range means there is more room below than above in the immediate window.Technical Verdict: BUY
The JournalArta research verdict is BUY, scored +66 on a −100 to +100 scale that flags BUY at +60 or above. The strongest reasons: price holds above its 50-day average with the 20-day average also above the 50-day in an intact uptrend; the RSI at 56.6 sits in the healthy 50–70 zone with room before overbought; and the code's signal set flashes a pullback to the SMA20 within an uptrend, with no bearish signals. The verdict would be invalidated if price breaks below $330.01, the stop level. - Entry Range: $345.37 – $352.45 - Exit Target 1: $386.11 | Target 2: $419.77 - Stop Loss: $330.01 (reward/risk 1.5 / 3.0), levels valid until December 17, 2026 In plain English: the setup leans higher because the stock is holding its trend and the price coil is more likely to resolve upward — but thin volume keeps this a cautious lean rather than a confident charge. The verdict is a technical read, not an investment recommendation; the site disclaimer applies. The next scheduled test is how Apple closes relative to the $356.27 resistance and the $347.69 20-day average, with the verdict's levels running valid through December 17, 2026.Summary Data AAPL
| Last price | 352.45 USD |
| Change 1 day / 5 days / 1 month | 0.15% / -0.89% / 2.46% |
| Trend / MA-cross | uptrend / none |
| SMA20 / SMA50 | 347.69 / 341.15 |
| RSI (14) / Stochastic %K | 56.6 / 76.4 |
| Bollinger %B / ATR | 70% / 9.44 |
| Support / Resistance 20 days | 331.90 / 356.27 |
| Data as of | 19 November 2026 04:00 WIB |
| JournalArta research verdict (score) | Buy (+66) |
| Entry zone | 345.37 – 352.45 |
| Target 1 / 2 | 386.11 / 419.77 |
| Stop loss | 330.01 |
| Reward/risk | 1.5 / 3.0 |
Today's full Buy and Sell list for US stocks →
Disclaimer: This technical analysis is generated automatically from exchange data and indicators calculated by JournalArta, for information and education only. The verdict and the entry, target and stop-loss levels are not investment advice or a solicitation to buy or sell any security. Investment decisions and their risks rest solely with the reader.
Track AAPL stock price daily: live levels, support/resistance and our full AAPL analysis history.
 Take the quizWhat Kind of Holiday Spender Are You? Take the Black Friday QuizStart →
- 1Gold Silver Price November: Futures Rise Near Yearly Lows

- 2U.S. Emergency Alert Test Nov. 17 Is Not a Power Outage

- 3Michael Clarke Says Sandpapergate Scars Drew Steve Smith to New York

- 42027 NFL Mock Draft Puts Ohio State’s Jeremiah Smith at No. 1

- 5Brent Crude Slides 4.05% as Rising US Stockpiles Weigh on Oil
 Lifestyle · Food & HealthWhat Is Raynaud’s Syndrome? Why Fingers Turn White in the Cold
 Lifestyle · Food & Health4 Ways Walking After Meals Helps Your Body, Doctors Say
 Lifestyle · Food & Health4 Reasons to Eat Oatmeal, According to Nutrition Experts
 Lifestyle7 Signs Your Social Battery Is Running Low (and Why You Keep Cancelling Plans)