CCEP Stock Rises 0.37%: Up 7.8% in a Month
Technical analysis of CCEP stock on November 18, 2026: price 118.86 USD, trend uptrend, RSI 63.8, support 110.84, resistance 119.19.
Why CCEP is in focus today
Selected automatically from 11 NASDAQ (US) stocks by a technical-signal score with daily weighted randomisation — not a recommendation.
Trend & Price Action
The structural picture is unambiguous. At 118.86, the shares sit above the 20-day average of 115.24 and well above the 50-day average of 108.44, a gap of roughly 10% to the medium-term mean that reflects a trend already some weeks old rather than a fresh breakout. No new moving-average cross has formed, so the bullish alignment of the 20-day above the 50-day is inherited, not newly minted — a distinction that matters because it means the trend has already been tested and held once. The Bollinger configuration tells the near-term story. The upper band sits at 121.18 and the lower at 109.30, with the middle at 115.24 and a band width of 10.3% — normal by historical standards. At 80% of band width, the stock is trading in the upper fifth of its volatility envelope, close enough to the upper band that incremental upside requires either a band expansion or a pause. The 20-day support at 110.84 and resistance at 119.19 frame the immediate battlefield; the shares are pinned just under resistance rather than pressing through it.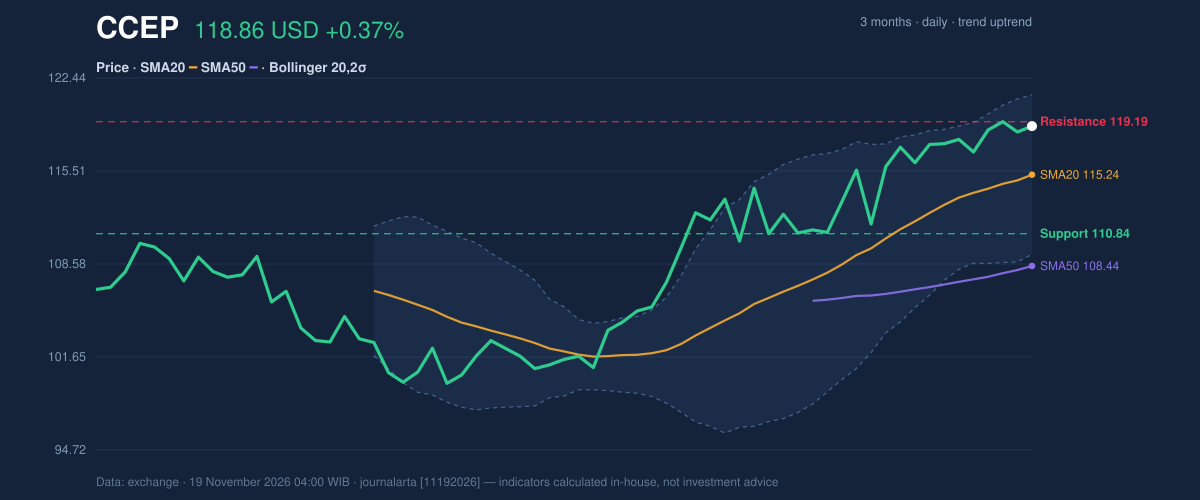
Oscillators & Momentum
Momentum is where the signals start to disagree. The MACD reads 2.875 against a signal line of 2.824, a histogram of 0.050 — positive, but thin. That is the signature of an uptrend that is still intact but decelerating in force; the gap between the two lines has narrowed to a sliver, which historically precedes either a re-acceleration or a rollover. The RSI at 63.8 sits in neutral territory but has been rolling over from above 65, which the code flags as a bearish counter-signal. Meanwhile the Stochastic is at %K 83.0 against %D 84.4 — firmly in overbought territory with the faster line already below the slower one. Read together, these three do not say the trend is broken; they say the buyers who drove the last leg are running out of marginal fuel.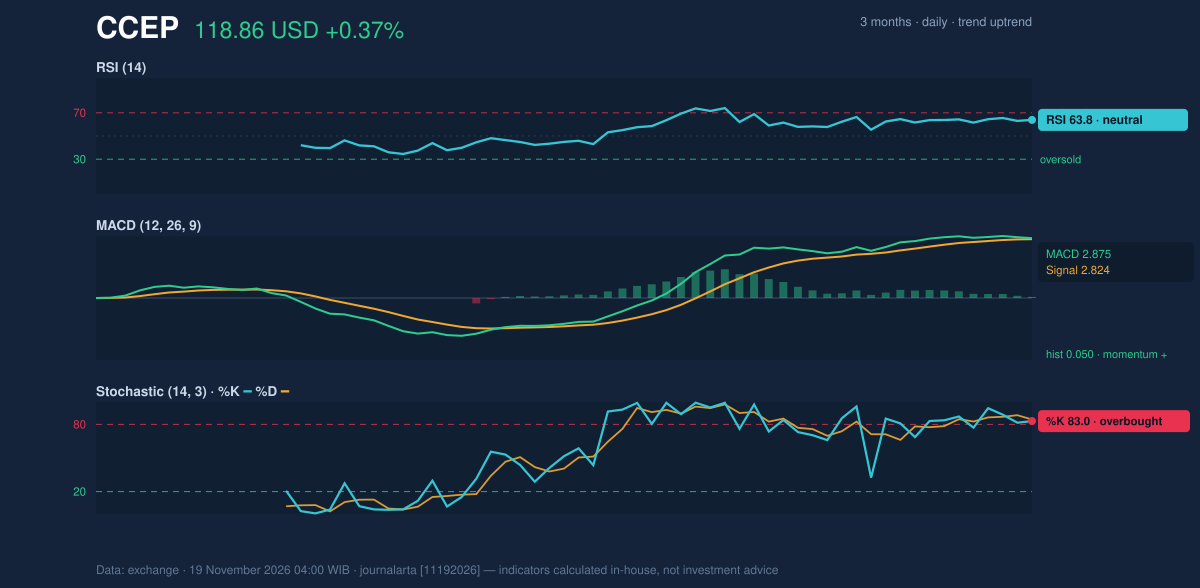
Volatility & Volume
The ATR of 2.86 represents 2.4% of the price, which is moderate volatility — neither a coiled spring nor a runaway tape. For a general reader, that simply means a normal day's swing is under three dollars, so the gap between entry and stop needs to be sized against that, not against the headline percentage moves. Volume is the quiet confirmation. The last session traded 1,829,600 shares against a 20-day average of 1,756,295 — 1.0× normal, essentially no surge. That is unremarkable on its own, but paired with a rising OBV it means participation has been consistent rather than event-driven. OBV rising while price grinds higher is the healthier version of an advance: accumulation, not a squeeze. The caveat is that without a volume expansion, a convincing break of resistance is harder to engineer.Key Levels & Scenarios
The decisive line is 119.19, the 20-day resistance, with the three-month high of 120.41 just above it and the upper Bollinger band at 121.18. A close above that cluster would require volume expansion to be credible; if it fails to hold 119.19, the first meaningful floor is the 20-day average at 115.24, then the 20-day support at 110.84. The 50-day at 108.44 is the deeper line in the sand — a break there would invalidate the entire structure. The pullback-to-the-SMA20-within-an-uptrend signal, one of the two bullish flags in the data, points to 115.24 as the zone where buyers have historically re-engaged. That is the more probable path given the oscillator warnings.Technical Verdict: BUY
The verdict is BUY, consistent with the JournalArta research score of +76 on a −100 to +100 scale. The three strongest supports: price above its 50-day average, the 20-day average above the 50-day, and an uptrend confirmed by rising OBV — a trend structure that has survived a full month of gains. - Entry range: 116.73 – 118.86 - Exit targets: 126.13 (target 1), 133.41 (target 2) - Stop loss: 114.01 - Reward/risk: 1.5 / 3.0; valid until 17 December 2026 The verdict is invalidated if price breaks below 114.01, the stop level, which would put the 20-day support at 110.84 in play and undercut the trend premise. The residual risk is the RSI rollover from above 65 and the Stochastic's overbought reading — timing friction, not a trend reversal. In plain terms: the trend is up and the data supports staying with it, but the technical case rests on buying a controlled pullback rather than chasing a stock pressed against resistance. The shares ended the session at 118.86, 0.55 below the 20-day resistance of 119.19, with volume at 1.0× its 20-day average.Summary Data CCEP
| Last price | 118.86 USD |
| Change 1 day / 5 days / 1 month | 0.37% / 0.84% / 7.77% |
| Trend / MA-cross | uptrend / none |
| SMA20 / SMA50 | 115.24 / 108.44 |
| RSI (14) / Stochastic %K | 63.8 / 83.0 |
| Bollinger %B / ATR | 80% / 2.86 |
| Support / Resistance 20 days | 110.84 / 119.19 |
| Data as of | 19 November 2026 04:00 WIB |
| JournalArta research verdict (score) | Buy (+76) |
| Entry zone | 116.73 – 118.86 |
| Target 1 / 2 | 126.13 / 133.41 |
| Stop loss | 114.01 |
| Reward/risk | 1.5 / 3.0 |
Today's full Buy and Sell list for US stocks →
Disclaimer: This technical analysis is generated automatically from exchange data and indicators calculated by JournalArta, for information and education only. The verdict and the entry, target and stop-loss levels are not investment advice or a solicitation to buy or sell any security. Investment decisions and their risks rest solely with the reader.
Track CCEP stock price daily: live levels, support/resistance and our full CCEP analysis history.
 Take the quizWhat Kind of Holiday Spender Are You? Take the Black Friday QuizStart →
- 1Gold Silver Price November: Futures Rise Near Yearly Lows

- 2Michael Clarke Says Sandpapergate Scars Drew Steve Smith to New York

- 3U.S. Emergency Alert Test Nov. 17 Is Not a Power Outage

- 42027 NFL Mock Draft Puts Ohio State’s Jeremiah Smith at No. 1

- 5Brent Crude Slides 4.05% as Rising US Stockpiles Weigh on Oil
 Lifestyle · Food & HealthWhat Is Raynaud’s Syndrome? Why Fingers Turn White in the Cold
 Lifestyle · Food & Health4 Ways Walking After Meals Helps Your Body, Doctors Say
 Lifestyle · Food & Health4 Reasons to Eat Oatmeal, According to Nutrition Experts
 Lifestyle7 Signs Your Social Battery Is Running Low (and Why You Keep Cancelling Plans)