Regeneron Pharmaceuticals (REGN) Stock Falls 1.28% (November 18, 2026): Up 17.4% in a Month
Technical analysis of REGN stock on November 18, 2026: price 945.53 USD, trend uptrend, RSI 64.1, support 805.02, resistance 973.36.
Why REGN is in focus today
Selected automatically from 11 NASDAQ (US) stocks by a technical-signal score with daily weighted randomisation — not a recommendation.
Trend & Price Action
The structural picture remains firmly bullish. The last price sits above both the 20-day average at 901.91 and the 50-day average at 824.37, and the 20-day average itself rose 4.52% over the past five days — a slope that confirms the uptrend rather than merely reflecting an old rally. No new moving-average cross has formed, which matters: the stock is riding an established trend, not a fresh signal that needs re-validation. What gives the session its texture is the location within the range. With 20-day support at 805.02 and resistance at 973.36, the close at 945.53 leaves roughly 28 points to the resistance ceiling and the three-month high of 991.73 just beyond it. The three-month low of 722.02 is now far below — a reminder of how much ground has been recovered. The mild five-day decline of 1.45% against the one-month gain of 17.36% tells you the selling has been shallow and contained.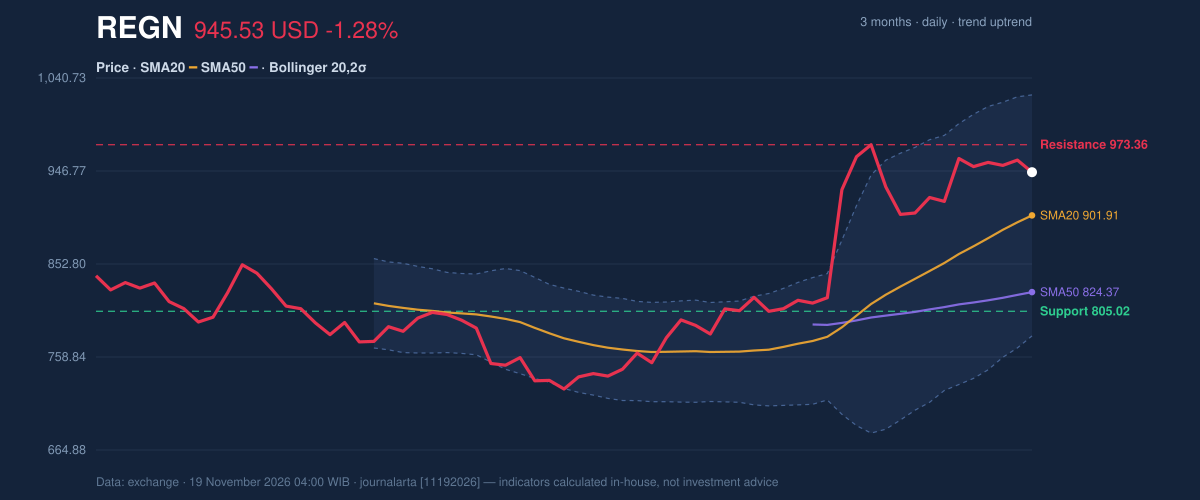
Oscillators & Momentum
Momentum is where the caution enters. RSI(14) at 64.1 sits in neutral territory but, crucially, is rolling over from above 65 — a classic early sign that buying pressure is easing even as price holds near highs. The stochastic readings reinforce the message: %K at 69.7 has slipped below %D at 76.7, a bearish crossover in the making that often precedes short-term consolidation. The longer-horizon momentum measure disagrees, and that disagreement is informative. MACD at 39.911 remains above its signal line at 38.648, with a positive histogram of 1.262 — momentum is still on the bulls' side, just with a thinner cushion than a month ago. In practice, this setup describes a stock digesting a strong advance: the fast oscillators cool while the trend gauge holds. That is a pullback profile, not a reversal profile, and it lines up with the price action.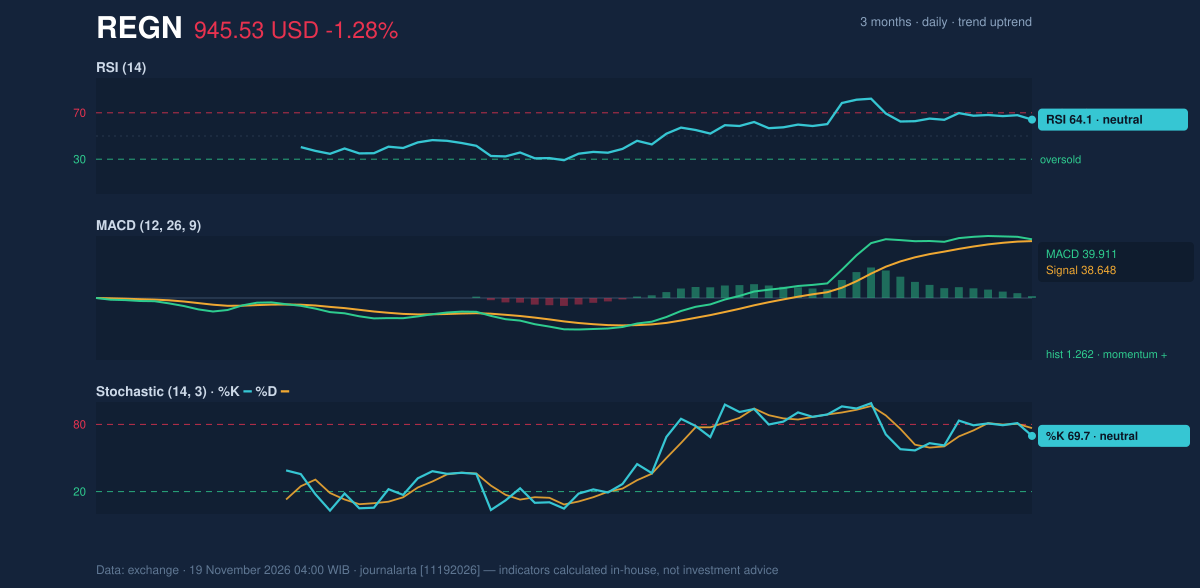
Volatility & Volume
Volatility is running hot. The Bollinger band width has expanded to 27.0%, with the upper band at 1,023.64 and the lower at 780.17, and %B at 68% places the close in the upper-middle of that envelope — room to run, but also room to swing. ATR(14) of 40.04 USD, or 4.2% of the price, quantifies the daily risk: readers should expect moves of that size to be routine rather than alarming. Volume is the one genuinely soft spot. The latest session's 705,100 shares came in at just 0.7× the 20-day average of 1,041,495 — thin participation behind the decline. Yet On-Balance Volume is rising, meaning the cumulative volume flow still favors accumulation. Thin selling into a rising OBV is a far more benign combination than heavy selling into a falling OBV; the pullback lacks conviction from the bear side.Fundamental Context
The technical resilience has a fundamental backdrop. According to its SEC filing, Regeneron reported quarterly revenue of $5.12 billion for the quarter ended September 30, 2026, up 36.3% from $3.75 billion a year earlier, with net income of $1.95 billion versus $1.46 billion and diluted earnings per share of $18.45. That is the kind of growth profile that gives a chart like this one its staying power — and it explains why dips toward the 20-day average have been absorbed rather than extended.Key Levels & Scenarios
The levels to watch are unambiguous. On the upside, a close above 973.36 would clear 20-day resistance and open the path toward the three-month high at 991.73; the Bollinger upper band at 1,023.64 marks the next stretch target if that breakout holds. On the downside, the first real test is the 20-day average at 901.91, which coincides with the lower edge of the current entry zone. A failure to hold that area would shift attention to the 805.02 support — a level roughly 15% below the last close. The volume question cuts both ways. If the next session brings a bounce on volume above the 1.04 million 20-day average, the pullback is confirmed as a pause. If instead the stock loses 901.91 on heavy volume, the bearish RSI rollover would graduate from warning to signal.Technical Verdict: BUY
The verdict is BUY, supported by three factors. First, price sits above the 50-day average at 824.37 and the 20-day average is above the 50-day, an intact uptrend structure. Second, the recent dip represents a pullback to the SMA20 within that uptrend, the highest-quality entry pattern the trend offers. Third, OBV is rising, confirming that participation still leans to the accumulation side despite the soft session. The invalidation condition is explicit: the verdict fails if price breaks below the stop loss at 877.37. - Entry Range: 915.47 – 945.53 - Exit Target 1: 1,047.77 - Exit Target 2: 1,150.01 - Stop Loss: 877.37 - Reward/Risk: 1.5 to 3.0 | Setup valid until December 17, 2026 In plain terms: the trend and the momentum engine both still point higher, so the current dip reads as an opportunity within an advance rather than the start of a decline — though the RSI rollover and thin volume mean the next session's participation will decide how quickly that plays out. *This is technical analysis for educational purposes, not an investment recommendation. Prices are in USD as of the November 18, 2026 session.*Summary Data REGN
| Last price | 945.53 USD |
| Change 1 day / 5 days / 1 month | -1.28% / -1.45% / 17.36% |
| Trend / MA-cross | uptrend / none |
| SMA20 / SMA50 | 901.91 / 824.37 |
| RSI (14) / Stochastic %K | 64.1 / 69.7 |
| Bollinger %B / ATR | 68% / 40.04 |
| Support / Resistance 20 days | 805.02 / 973.36 |
| Data as of | 19 November 2026 04:00 WIB |
| JournalArta research verdict (score) | Buy (+66) |
| Entry zone | 915.47 – 945.53 |
| Target 1 / 2 | 1,047.77 / 1,150.01 |
| Stop loss | 877.37 |
| Reward/risk | 1.5 / 3.0 |
Disclaimer: This technical analysis is generated automatically from exchange data and indicators calculated by JournalArta, for information and education only. The verdict and the entry, target and stop-loss levels are not investment advice or a solicitation to buy or sell any security. Investment decisions and their risks rest solely with the reader.
Track REGN stock price daily: live levels, support/resistance and our full REGN analysis history.
 Take the quizWhat Kind of Holiday Spender Are You? Take the Black Friday QuizStart →
Most Read
- 1Gold Silver Price November: Futures Rise Near Yearly Lows

- 2Michael Clarke Says Sandpapergate Scars Drew Steve Smith to New York

- 3U.S. Emergency Alert Test Nov. 17 Is Not a Power Outage

- 42027 NFL Mock Draft Puts Ohio State’s Jeremiah Smith at No. 1

- 5Brent Crude Slides 4.05% as Rising US Stockpiles Weigh on Oil
Don't Miss
 Lifestyle · Food & HealthWhat Is Raynaud’s Syndrome? Why Fingers Turn White in the Cold
 Lifestyle · Food & Health4 Ways Walking After Meals Helps Your Body, Doctors Say
 Lifestyle · Food & Health4 Reasons to Eat Oatmeal, According to Nutrition Experts
 Lifestyle7 Signs Your Social Battery Is Running Low (and Why You Keep Cancelling Plans)