GE HealthCare (GEHC) Stock Climbs 2.22% on Wednesday, Up 21.2% in a Month
Technical analysis of GEHC stock on November 18, 2026: price 83.66 USD, trend uptrend, RSI 66.9, support 71.11, resistance 85.81.
Why GEHC is in focus today
- One-day move of 0.00%, about 0.0× its average daily range (ATR)
Selected automatically from 11 NASDAQ (US) stocks by a technical-signal score with daily weighted randomisation — not a recommendation.
Trend & Price Action
The 20-day average stands at 79.53 USD and the 50-day at 71.50 USD, with the last price above both. The 20-day average rose 4.22% over five days, and no new moving-average cross formed on the latest session — the up-sloping short-term average above the longer one is an existing condition, not a fresh trigger. Read plainly, the trend is intact and upward. Price has travelled to the top of its recent range: the 20-day support is 71.11 USD, the 20-day resistance 85.81 USD, and the stock sits at about 85% of that band. The three-month high of 87.56 USD and low of 62.99 USD put the current level near the upper end of the quarter's range, which is a structural signal of strength but also leaves less room before overhead supply appears.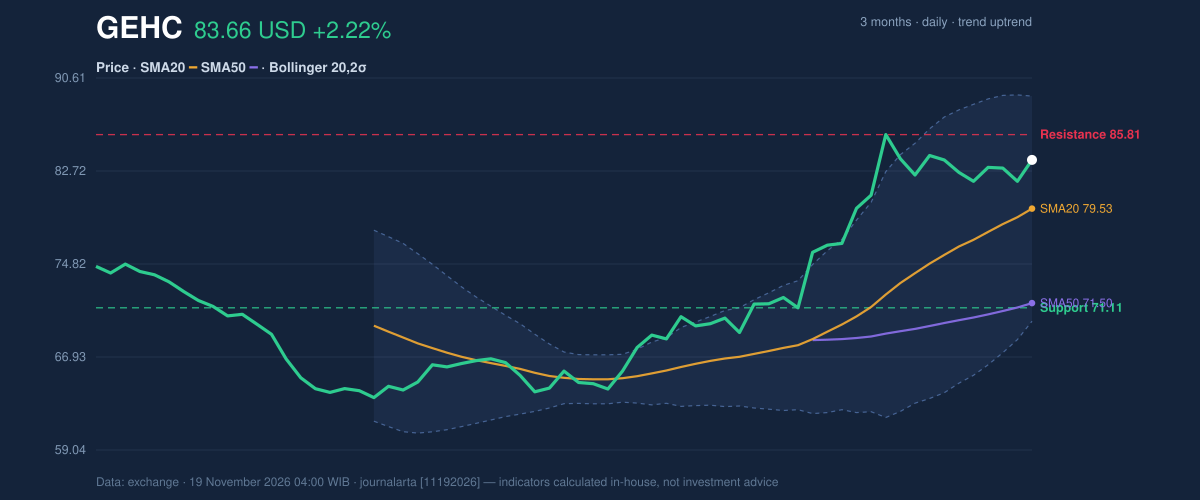
Oscillators & Momentum
The momentum picture is mixed and worth separating by indicator. RSI(14) sits at 66.9, in neutral territory but close to the threshold traders read as stretched; Stochastic %K is 65.7 against %D at 61.0, also neutral and showing no crossover signal. Neither oscillator is flashing exhaustion, which is consistent with an orderly advance. The MACD is the caution flag. The line at 3.454 is slightly below its signal at 3.596, producing a histogram of −0.142. That negative histogram is the one bearish signal in the computed set of seven, and its meaning is narrow: the pace of the advance has cooled even while the level remains elevated. A negative histogram during a price rally is a deceleration signal, not a reversal by itself. The simplest way to say it: the buyers are still ahead, but they are no longer pulling away.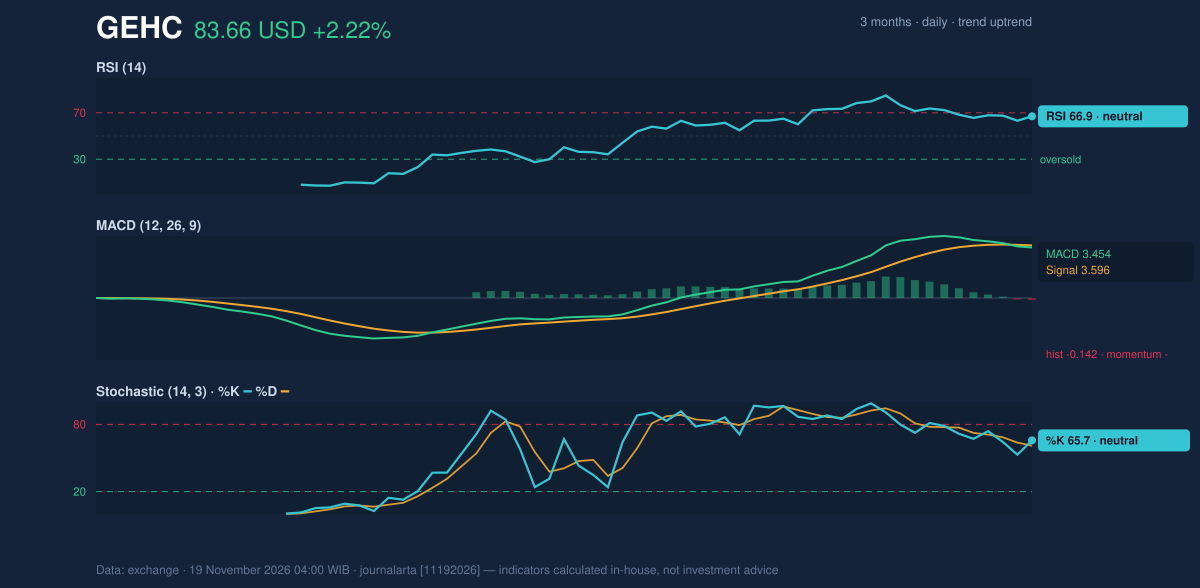
Volatility, Volume & Key Levels
Volume is where the confirmation thins out. The latest session traded 3,651,200 shares against a 20-day average of 4,415,880, or 0.8× normal. A rally on below-average participation deserves attention, and on-balance volume declining while price gains adds a second divergence: more shares have changed hands on weaker days than on stronger ones. Neither is fatal to the uptrend, but together they argue the advance has fewer fresh entrants than the price suggests. ATR at 2.59 USD, about 3.1% of the price, describes moderate volatility — large enough that a 2–3% daily move is routine, small enough that the trend structure is not being torn up session to session. The levels that matter are the ones a breakout or breakdown would resolve. A sustained move above 85.81 USD opens the path toward the Bollinger upper band at 89.08 USD and the three-month high of 87.56 USD. Failure to hold the 20-day area near 79.53 USD, followed by a break of 20-day support at 71.11 USD, would put the 50-day at 71.50 USD in play — a level that has so far stayed well below the market.Fundamental Context
The technical setup is not running counter to the business. GE HealthCare reported quarterly revenue of $5.51 billion for the quarter ended September 30, 2026, up 7.2% from $5.14 billion a year earlier, with net income of $615.0 million and diluted earnings per share of $1.36, according to its SEC filing. The company also filed a Form 8-K on November 5, 2026, reporting a change of directors or officers — a governance item investors should treat as information, not a signal.Technical Verdict: BUY
The call is BUY, and it rests on structure rather than momentum. Three reasons carry it: price above the 50-day average at 71.50 USD with the 20-day average above it and rising 4.22% over five days; RSI at 66.9 in the constructive 50–70 zone without being overbought; and the stock holding 85% of its 20-day range with room to the upper band. - Entry zone: 81.72 – 83.66 USD - Exit target 1: 90.27 USD - Exit target 2: 96.89 USD - Stop loss: 79.25 USD - Reward/risk: 1.5 to 3.0 - Valid until: December 17, 2026 The verdict is invalidated if price breaks below 79.25 USD. The MACD histogram at −0.142 and declining volume are the risks to watch, not reasons to abandon the call. In plain terms: the trend and the averages favour further gains, the momentum gauges say the easy part of the move is done, and the stop loss marks where that view stops being true.Summary Data GEHC
| Last price | 83.66 USD |
| Change 1 day / 5 days / 1 month | 2.22% / 1.28% / 21.23% |
| Trend / MA-cross | uptrend / none |
| SMA20 / SMA50 | 79.53 / 71.50 |
| RSI (14) / Stochastic %K | 66.9 / 65.7 |
| Bollinger %B / ATR | 72% / 2.59 |
| Support / Resistance 20 days | 71.11 / 85.81 |
| Data as of | 19 November 2026 04:00 WIB |
| JournalArta research verdict (score) | Buy (+60) |
| Entry zone | 81.72 – 83.66 |
| Target 1 / 2 | 90.27 / 96.89 |
| Stop loss | 79.25 |
| Reward/risk | 1.5 / 3.0 |
Today's full Buy and Sell list for US stocks →
Disclaimer: This technical analysis is generated automatically from exchange data and indicators calculated by JournalArta, for information and education only. The verdict and the entry, target and stop-loss levels are not investment advice or a solicitation to buy or sell any security. Investment decisions and their risks rest solely with the reader.
Track GEHC stock price daily: live levels, support/resistance and our full GEHC analysis history.
 Take the quizWhat Kind of Holiday Spender Are You? Take the Black Friday QuizStart →
- 1Gold Silver Price November: Futures Rise Near Yearly Lows

- 2Michael Clarke Says Sandpapergate Scars Drew Steve Smith to New York

- 3U.S. Emergency Alert Test Nov. 17 Is Not a Power Outage

- 42027 NFL Mock Draft Puts Ohio State’s Jeremiah Smith at No. 1

- 5Brent Crude Slides 4.05% as Rising US Stockpiles Weigh on Oil
 Lifestyle · Food & HealthWhat Is Raynaud’s Syndrome? Why Fingers Turn White in the Cold
 Lifestyle · Food & Health4 Ways Walking After Meals Helps Your Body, Doctors Say
 Lifestyle · Food & Health4 Reasons to Eat Oatmeal, According to Nutrition Experts
 Lifestyle7 Signs Your Social Battery Is Running Low (and Why You Keep Cancelling Plans)