Qualcomm (QCOM) Stock Update: Slides 4.12%, Down 10.2% in a Month
Technical analysis of QCOM stock on November 18, 2026: price 159.81 USD, trend downtrend, RSI 40.2, support 156.75, resistance 185.41.

Why QCOM is in focus today
- One-day move of 0.00%, about 0.0× its average daily range (ATR)
Selected automatically from 11 NASDAQ (US) stocks by a technical-signal score with daily weighted randomisation — not a recommendation.
Trend & Price Action
The structure is unambiguously bearish. The stock trades below both its 20-day average of $171.69 and its 50-day average of $178.25, with the 20-day average itself slipping 0.95% over five days. No fresh moving-average cross formed in the latest session; the downslope is the signal, not a sudden event. The price is now 6.9% below the 20-day line — a gap wide enough to invite a technical bounce, which is precisely what the bearish signal set flags: a bounce into the 20-day average inside a downtrend.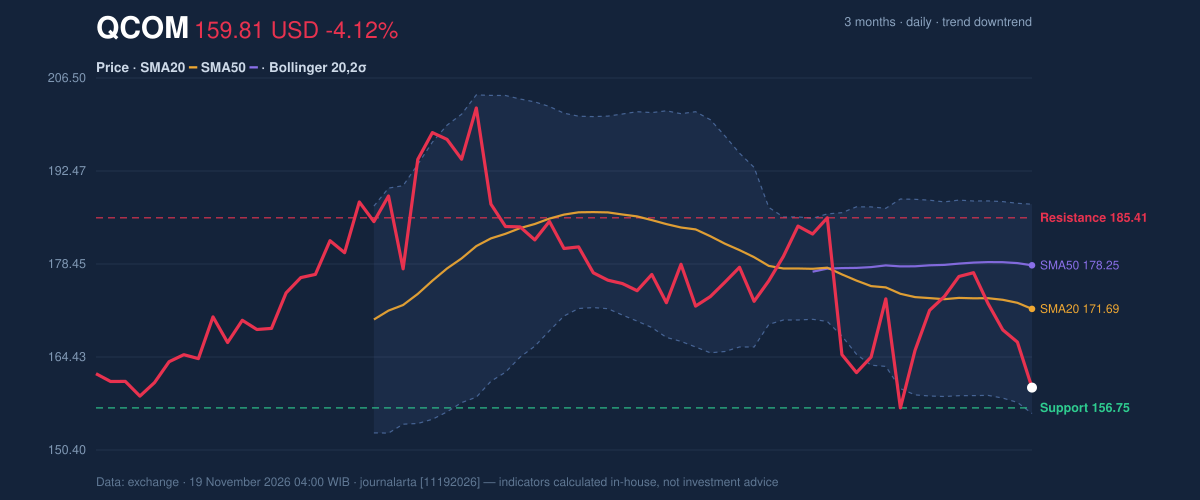
Oscillators & Momentum
Momentum confirms rather than contradicts the trend. RSI(14) sits at 40.2 — neutral, but on the bearish side of the 50 line, with room to fall before reaching oversold territory. Stochastic is softer still: %K at 32.9 against %D at 45.5, the faster line beneath the slower one, which describes momentum that is deteriorating rather than bottoming. MACD is the decisive piece: the reading of -2.659 against a signal line of -2.080 gives a negative histogram of -0.579, and that histogram has just turned negative — a fresh bearish inflection, not a stale one.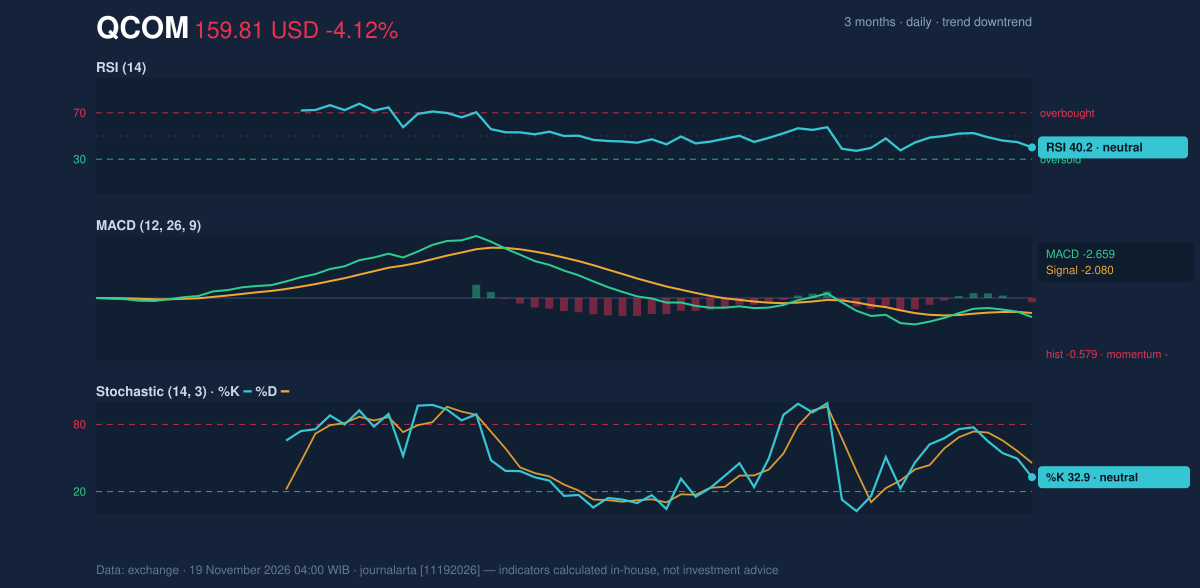
Volatility, Bands & Participation
Bollinger bands frame the risk. The 20-day band runs from $155.91 to $187.46 around the $171.69 midpoint, a normal 18.4% width, and %B reads 12% — price is pressed near the lower band. ATR(14) of 10.99, or 6.9% of the share price, tells readers plainly that this is a high-volatility name: single-digit percentage swings are routine, so a 4% down day is not an outlier. On balance volume is falling, a third bearish input. The combination of a thin session and weakening OBV means holders are leaving quietly rather than being forced out. That is a slow bleed, and it usually takes time to resolve.Fundamental Context
The technical weakness has a fundamental backdrop, according to its SEC filing. Qualcomm reported revenue of $43.12 billion for the fiscal year ended September 27, 2026, down 2.6% from $44.28 billion a year earlier, while net income rose to $13.63 billion from $5.54 billion, with diluted earnings per share of $12.70, per the Form 10-K filed November 4. The company also disclosed a material definitive agreement in a Form 8-K filed November 13. Margins improved even as the top line shrank — a mix story the market has so far chosen to price through the demand lens.Key Levels & Scenarios
Support sits at $156.75, the 20-day floor, with the lower Bollinger band at $155.91 reinforcing it; resistance is at $185.41. The conditional paths are clean. If buyers defend $156.75, a repair bounce toward the $171.69 average is the first test and $178.25 the harder one. If that support fails on rising volume, the March low of $148.25 comes into play as the next reference — and the volume question is the one to watch, because Wednesday's 0.6× tape suggests neither side is committed yet.Technical Verdict: SELL
The computed JournalArta research verdict is SELL, scoring -84 on a -100 to +100 scale, with zero bullish against three bearish signals: a negative MACD histogram, a bounce into the falling 20-day average while below the 50-day, and a downtrend confirmed by falling OBV. Price sits below its long-term average, the 20-day sits below the 50-day, and ATR of 6.9% means stops must be sized generously. - Sell zone: $159.81 – $168.05 - Target 1: $131.76 - Target 2: $103.71 - Stop Loss: $178.51 - Reward/risk: 1.5 / 3.0, valid until December 17, 2026 The verdict is invalidated if price closes above $178.51, the stop level above the 50-day average. In plain English: the chart says the path of least resistance still points down. The Form 8-K filing of November 13 remains the newest disclosed event in the record as of Wednesday's close.Summary Data QCOM
| Last price | 159.81 USD |
| Change 1 day / 5 days / 1 month | -4.12% / -9.49% / -10.20% |
| Trend / MA-cross | downtrend / none |
| SMA20 / SMA50 | 171.69 / 178.25 |
| RSI (14) / Stochastic %K | 40.2 / 32.9 |
| Bollinger %B / ATR | 12% / 10.99 |
| Support / Resistance 20 days | 156.75 / 185.41 |
| Data as of | 19 November 2026 04:00 WIB |
| JournalArta research verdict (score) | Sell (-84) |
| Sell zone | 159.81 – 168.05 |
| Target 1 / 2 | 131.76 / 103.71 |
| Stop loss | 178.51 |
| Reward/risk | 1.5 / 3.0 |
Today's full Buy and Sell list for US stocks →
Disclaimer: This technical analysis is generated automatically from exchange data and indicators calculated by JournalArta, for information and education only. The verdict and the entry, target and stop-loss levels are not investment advice or a solicitation to buy or sell any security. Investment decisions and their risks rest solely with the reader.
Track QCOM stock price daily: live levels, support/resistance and our full QCOM analysis history.
 Take the quizWhat Kind of Holiday Spender Are You? Take the Black Friday QuizStart →
- 1Gold Silver Price November: Futures Rise Near Yearly Lows

- 2Michael Clarke Says Sandpapergate Scars Drew Steve Smith to New York

- 3U.S. Emergency Alert Test Nov. 17 Is Not a Power Outage

- 42027 NFL Mock Draft Puts Ohio State’s Jeremiah Smith at No. 1

- 5Brent Crude Slides 4.05% as Rising US Stockpiles Weigh on Oil
 Lifestyle · Food & HealthWhat Is Raynaud’s Syndrome? Why Fingers Turn White in the Cold
 Lifestyle · Food & Health4 Ways Walking After Meals Helps Your Body, Doctors Say
 Lifestyle · Food & Health4 Reasons to Eat Oatmeal, According to Nutrition Experts
 Lifestyle7 Signs Your Social Battery Is Running Low (and Why You Keep Cancelling Plans)