AMD Stock Technicals Today: Gains 4.76%, Momentum Gains
On Agustus 18, 2026: price 506.00 USD, trend sideways, RSI 53.9, support 429.56, resistance 552.33. technical analysis of amd stock. AMD Stock Technicals —…

International investors are watching whether AMD can hold its recovery above a key short-term average while momentum remains constructive but not yet fully confirmed. Shares of Advanced Micro Devices rose to 506.00 USD on Nasdaq, up 4.76% from the previous close of 483.01, as the stock moved back above its 20-day average even though the broader pattern still looks sideways.
Trend & Price Action
As shown in the chart, AMD is trading above its SMA20 at 494.24 but still below its SMA50 at 510.40, which places the stock in a transitional zone rather than a clean trend. That matters because price above the shorter average usually signals near-term stabilization, while price below the longer average suggests the market has not yet fully committed to a sustained uptrend.
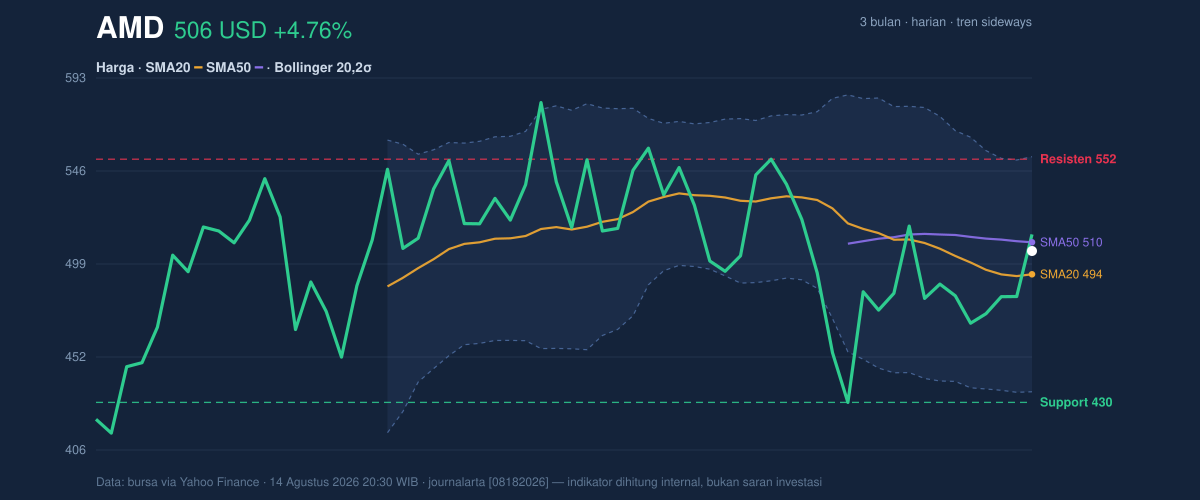
The absence of a fresh moving-average crossover also keeps the signal mixed. In plain terms, the stock has improved, but it has not delivered the kind of technical confirmation that would usually accompany a stronger directional move. The stated trend is sideways, and the SMA20 slope of -1.83% over five days shows the short-term average is still drifting lower, which means recent strength is fighting a slightly weakening baseline.
Positioning inside the broader range is also important. AMD sits around 62% of the 20-hour range, between support at 429.56 and resistance at 552.33. That tells readers the stock is not near panic levels, but it is also not yet testing the ceiling in a way that would suggest a breakout is already underway. The 3-month high of 584.73 and low of 393.36 frame the larger battleground: the shares have recovered well from the lower part of that band, but they remain below the recent peak.
Oscillators & Momentum
Momentum is better than the trend line alone would suggest. The MACD is -6.633 versus a signal line of -8.455, leaving a positive histogram of 1.822. That configuration means downside momentum has eased and the stock is gaining internal strength, even though the MACD itself is still below zero. In practical terms, the move is improving, but it has not yet crossed into a fully bullish regime.
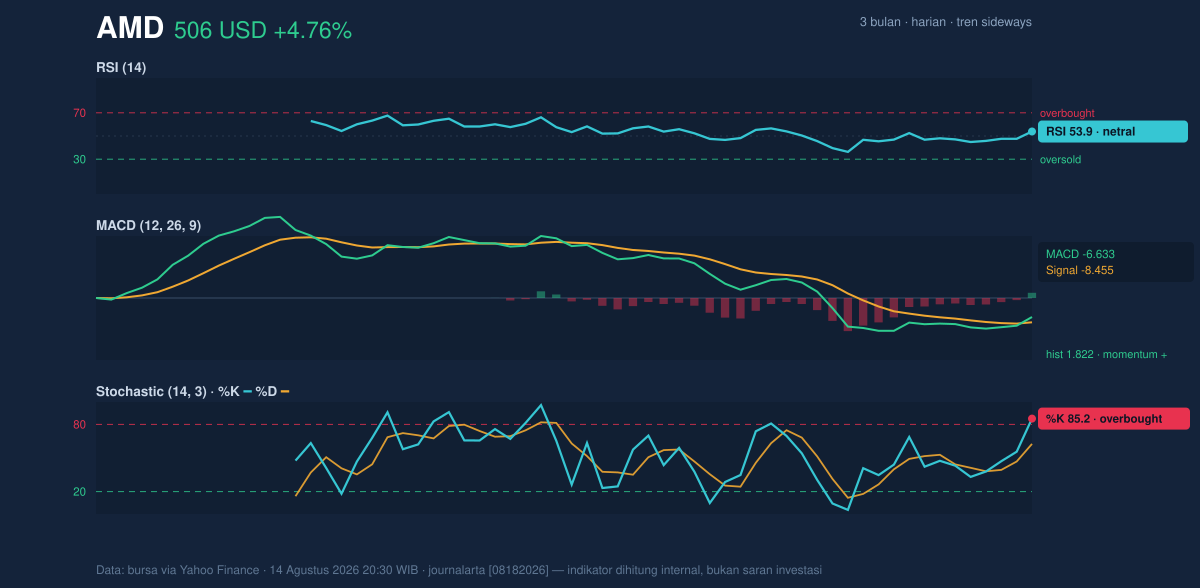
RSI at 53.9 is neutral, which is often the most useful reading when a stock is trying to build a new base. It says AMD is neither stretched nor washed out. By contrast, Stochastic %K at 85.2 and %D at 62.6 points to a short-term overbought condition. That combination matters: RSI is showing balance, while Stochastic says the latest push has been fast enough to leave the stock vulnerable to pauses or pullbacks. When those two disagree, it often means momentum is present, but the move may need to cool before it can extend cleanly.
Volatility & Volume
Bollinger Bands are widening, with the band width at 24.0%, and ATR(14) at 32.78 equals 6.5% of price. Those are both signs of elevated volatility. In simple language, the market is expecting larger-than-usual swings, so the next move could be sharp in either direction rather than slow and orderly.
The price is sitting at %B 60%, meaning it is above the middle Bollinger line at 494.24 but still well below the upper band at 553.59. That is a constructive position, because it shows the stock has recovered into the upper half of its volatility envelope without yet entering the overextended zone near the top band. Still, the widening bands also warn that any failure to hold gains could be punished quickly.
Volume adds a useful nuance. Last volume was 25,570,300, below the 20-hour average of 28,502,985, or 0.9× normal. So while the price rose strongly, participation was not especially heavy. That slightly softens the bullish message from the price move itself. On the other hand, OBV is rising, which suggests the flow of shares over time is still favoring accumulation. In market terms, that means buyers have been more persistent than the single-day volume number alone would imply.
Key Levels & Scenarios
The nearest technical map is clear. 494.24 is the first important pivot because it is both the SMA20 and Bollinger middle band. Holding above that zone helps preserve the current recovery. Above that, 510.40 is the next hurdle, since the SMA50 often acts as a test of whether a rebound can mature into a broader trend. Beyond that, 552.33 is the visible resistance line, closely aligned with the upper Bollinger band at 553.59, making that area the market’s obvious upside checkpoint.
On the downside, 429.56 is the key support to watch. A break below it would suggest the recent rebound has failed and that the stock may be rotating back toward the lower part of its range. Between those levels, the chart is essentially asking whether AMD can turn a bounce into a more durable advance.
Technical Verdict: HOLD (wait & see)
HOLD (wait & see)
- MACD histogram is positive at 1.822, showing improving momentum, but the MACD line remains below zero, so confirmation is incomplete.
- Price is above SMA20 at 494.24 but still below SMA50 at 510.40, which keeps the structure mixed rather than decisively bullish.
- Stochastic is overbought at 85.2 while Bollinger Bands are widening, so the stock may need a pause even after the recent rise.
Verdict invalidated if price falls below 429.56, because that would break the nearest major support and weaken the current recovery structure.
- Ideal entry range: 494.24 to 510.40
- Exit target: 552.33 to 553.59
- Stop loss protection: 429.56
For non-traders, this means AMD looks healthier than it did a few sessions ago, but the chart still needs proof that the rebound can survive the next test. “The stock is trying to turn the corner, but it has not finished the job.”
Summary Data AMD
| Last price | 506.00 USD |
| Change 1 day / 5 days / 1 month | 4.76% / 4.68% / 2.07% |
| Trend / MA-cross | sideways / none |
| SMA20 / SMA50 | 494.24 / 510.40 |
| RSI (14) / Stochastic %K | 53.9 / 85.2 |
| Bollinger %B / ATR | 60% / 32.78 |
| Support / Resistance 20 days | 429.56 / 552.33 |
| Data as of | 14 Agustus 2026 20:30 WIB |


