ADBE Stock Technicals Today: Gains 3.55%, Testing Key Resistance
On Agustus 20, 2026: price 272.47 USD, trend uptrend, RSI 61.3, support 212.17, resistance 272.96. technical analysis of adbe stock. ADBE Stock Technicals —…

Adobe Inc. pushed higher on the NASDAQ, with ADBE last trading at 272.47 USD, up from a previous close of 263.14, as the stock extended a short-term rally that has already lifted it 24.78% in 1 month. The move matters because it leaves the shares sitting near the top of their recent trading band, a position that often reflects strong buying interest but also raises the risk of fatigue when momentum indicators start to disagree. As shown in the chart, the stock is trading well above its short and medium-term averages, yet the latest signals are less uniformly bullish than the price action itself suggests.
Trend & Price Action
The broader structure remains constructive. ADBE is in an uptrend, and the stock is trading above both the SMA20 at 254.96 and the SMA50 at 231.22. That placement tells traders the recent advance is not just a one-day jump; it is occurring on top of a rising base, with the SMA20 slope up 3.48% over 5 days. In plain terms, the short-term trend is still pointing higher, and the fact that price remains above the faster average usually signals that dip buyers have been active.
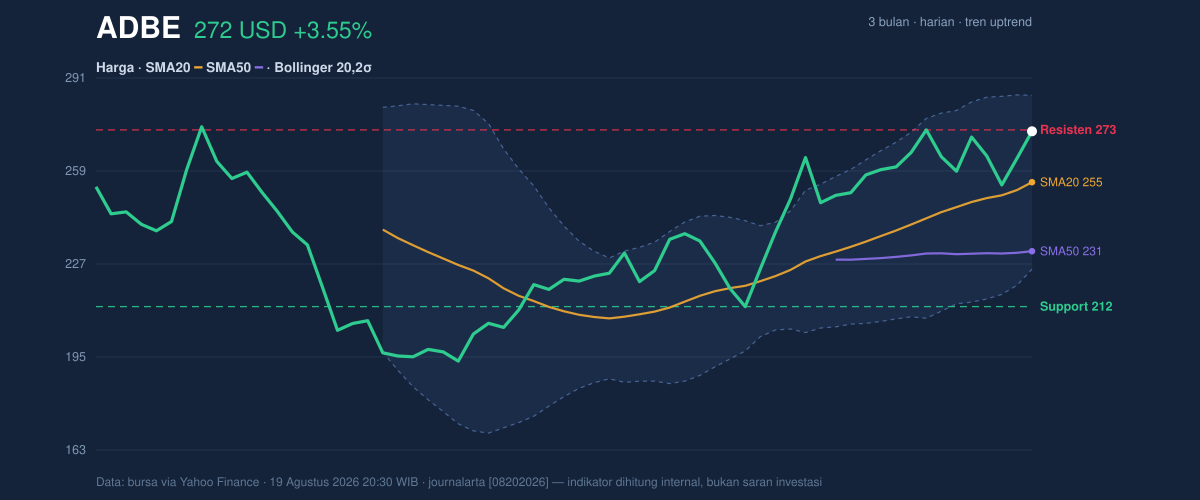
The catch is where the stock now sits within that structure. The 20-hour resistance at 272.96 is essentially being tested, while the 20-hour support at 212.17 is far below. With price at 99% of the recent range and only just below the 3-month high of 275.80, Adobe is trading in the uppermost part of its range. That is a sign of strength, but also a sign that a lot of the near-term optimism may already be reflected in the price.
A clean break above the recent ceiling would matter because it would show the rally is no longer just pressing against resistance — it is clearing it.
Oscillators & Momentum
The momentum picture is more mixed than the trend picture. RSI at 61.3 is neutral, which suggests the stock is not yet in an extreme condition by itself. But the Stochastic %K at 90.4 versus %D at 66.1 is a different signal: that reading is overbought, meaning short-term price has moved quickly and may be vulnerable to pauses or pullbacks if buying pressure eases. As shown in the chart, that overbought reading is arriving while price is already near the top of its range, which increases the chance of consolidation.
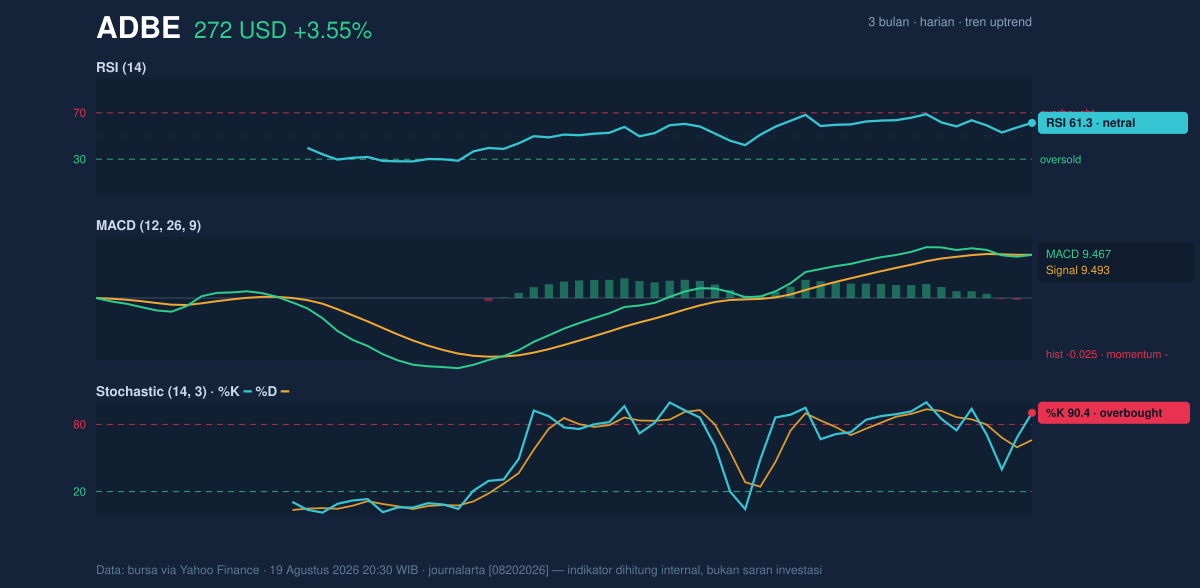
The more important caution comes from MACD. MACD at 9.467 sits just below the signal line at 9.493, with a histogram of -0.025. That small negative gap does not scream reversal, but it does mean the pace of the advance is no longer accelerating. In technical terms, the trend is still up, but the momentum engine is not pulling as hard as the price chart alone might imply. When a stock is near highs and MACD slips slightly negative, traders often watch for either a brief cooling-off period or a renewed push that confirms the breakout.
Volatility & Volume
Volatility is elevated. The Bollinger Bands are widening, with the upper band at 284.88, the middle band at 254.96, and the lower band at 225.03. A %B of 79% means price is trading closer to the upper band than the center line, which usually reflects strength — but also signals the stock is extended relative to its recent average. Wider bands are important because they often precede larger moves, not necessarily in one direction. In this case, the market is telling us that the next swing could be meaningful.
The ATR(14) at 11.24, or 4.1% of price, reinforces that message. ATR is a measure of typical daily movement, so a higher reading means the stock can move sharply in either direction without changing its broader trend. Volume adds a mild confirmation: last volume of 5,538,700 was about 1.1x normal, and OBV is rising. That combination suggests the rally is being supported by participation rather than drifting upward on weak turnover. Still, the volume edge is not dramatic enough to fully override the softer MACD reading.
Key Levels & Scenarios
The most immediate technical pivot is the 272.96 resistance. If Adobe can hold above that zone on a closing basis, the chart would begin to look like a fresh breakout attempt rather than just a test of prior highs. The next reference from the data is the upper Bollinger band at 284.88, which marks the area where the price would be stretching into the top of its current volatility envelope.
On the downside, the first meaningful cushion is the SMA20 at 254.96, which also matches the Bollinger middle band. That level matters because it separates a strong trend from a merely overextended one. If price slips below it, the market would be telling traders that the recent surge is losing traction. Below that, the lower Bollinger band at 225.03 offers the broader volatility floor, while the 20-hour support at 212.17 is the deeper line in the sand from the range data.
Technical Verdict: HOLD (wait & see)
- Reason 1: Trend remains positive — price is above both the SMA20 and SMA50, and the SMA20 slope is rising.
- Reason 2: Momentum is mixed — Stochastic is overbought, while MACD is slightly negative versus its signal line, hinting at slowing upside pressure.
- Reason 3: Price is stretched near resistance — 272.96 resistance is being tested, with price near the 3-month high of 275.80 and the upper Bollinger band at 284.88.
- Invalidation: this verdict is invalidated if price breaks below 254.96, the SMA20 / Bollinger middle band, because that would weaken the current trend structure.
- Ideal Entry Range: 254.96 to 272.96
- Exit Target: 284.88
- Stop Loss Protection: 225.03, with deeper risk control at 212.17
For non-traders, that means Adobe’s chart is still healthy, but the stock is close enough to resistance that the next move needs confirmation rather than assumption.
Summary Data ADBE
| Last price | 272.47 USD |
| Change 1 day / 5 days / 1 month | 3.55% / 5.30% / 24.78% |
| Trend / MA-cross | uptrend / none |
| SMA20 / SMA50 | 254.96 / 231.22 |
| RSI (14) / Stochastic %K | 61.3 / 90.4 |
| Bollinger %B / ATR | 79% / 11.24 |
| Support / Resistance 20 days | 212.17 / 272.96 |
| Data as of | 19 Agustus 2026 20:30 WIB |
Track ADBE stock price daily: live levels, support/resistance and our full ADBE analysis history.