DIS Stock Week Ahead: Levels and Scenarios for November 16–20
DIS stock week ahead for November 16–20: last close 118.97 USD, weekly change 1.90%, support 109.04, resistance 119.65.

Walt Disney (DIS) heads into the week of November 16–20 at $118.97, the close on November 13 on the NYSE, after a week that added 1.90% and left the stock just under the top of its 20-day range. Four up sessions out of five. A quiet advance, but a clean one.
Last Week in Review
Shares closed the week of November 9–13 at $118.97, against $116.75 on November 6, for a weekly change of 1.90%. The stock opened the week at $117.94, and the one-month gain stands at 7.58%.
The weekly high was $120.44 on November 12 and the low was $117.23 on November 9, a range of 2.74%. Friday's close sat at 54% of that range. The best session was November 9, up 2.03%; the worst was November 12, down 1.19%, the only down day of the week.
Participation was lighter than usual. Average daily volume came to 6,870,080 shares, or 0.84 times the 8,223,040 average of the prior 20 sessions. Gains on thinner volume are less convincing, though Friday's 7,717,000 shares was in line with the 20-day average of 7,744,850, and on-balance volume (OBV), a running tally of volume on up and down days, is rising.
Technical Map for the Week Ahead
The trend is up. The 20-day simple moving average (SMA20) sits at 114.28, with a slope of 2.14% over five days, and the price is above it. The 50-day average is at 109.20. No new moving-average crossover has formed.
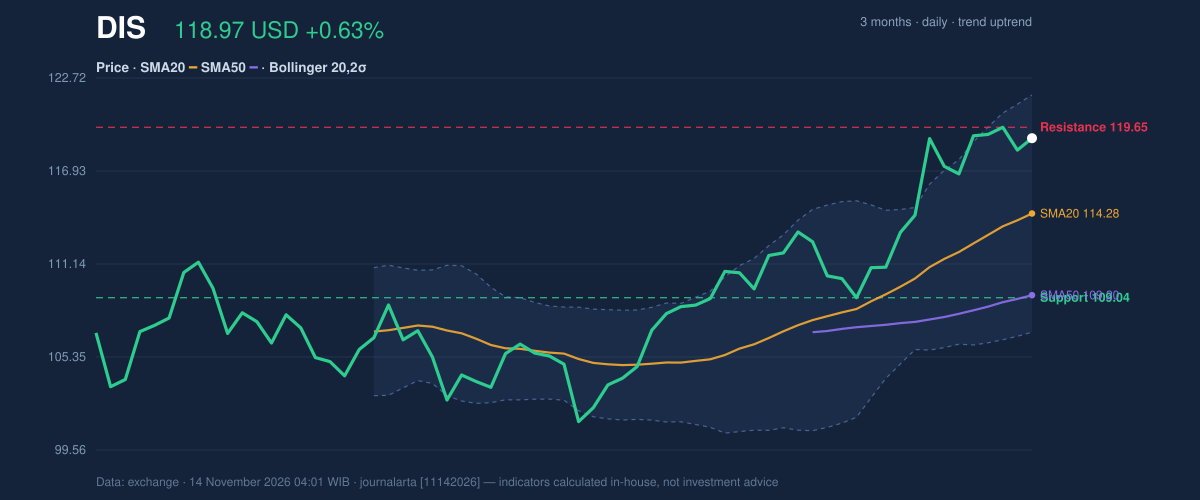
The chart shows the stock pressed against nearby resistance. The 20-day resistance is 119.65, and the stock sits at 94% of its 20-day range. The 20-day support is 109.04. The three-month high is 120.80 and the three-month low is 101.15, so Disney is trading within about 1.5% of its quarterly peak.
Bollinger Bands (a volatility envelope two standard deviations around the 20-day average) run from 106.90 to 121.67, with the midline at 114.28. The %B reading of 82% places the price in the upper part of the band, and band width of 12.9% is normal.
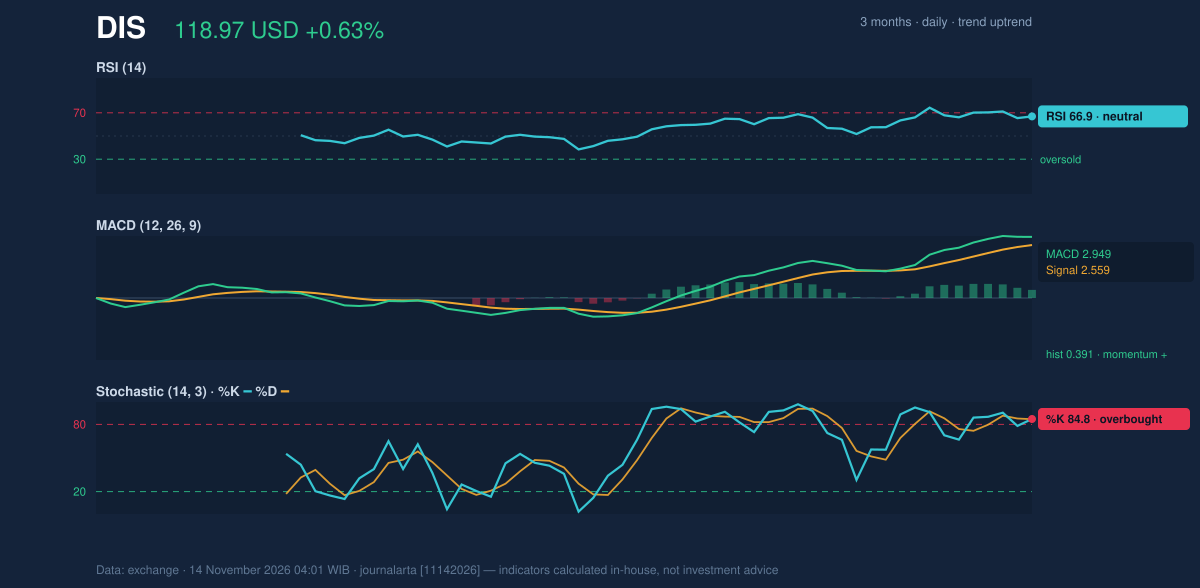
The momentum chart is mostly constructive with one caution. The 14-day Relative Strength Index (RSI) is 66.9, classed as neutral and below the conventional 70 overbought line. The MACD line is 2.949 against a signal line of 2.559, a histogram of 0.391, which signals positive momentum. The Stochastic oscillator is more stretched, with %K at 84.8 and %D at 84.6, both in overbought territory. Average true range (ATR), a measure of typical daily movement, is 2.53, or 2.1% of the price.
Bullish scenario: if the stock breaks above 20-day resistance at 119.65 and clears the three-month high of 120.80, the upper Bollinger Band at 121.67 comes into view. The code-computed first target is 125.43.
Bearish scenario: if it slips below the stop level of 114.66, close to the SMA20 at 114.28, the week's gains would be at risk. A deeper move would bring the Bollinger midline and then the 20-day support at 109.04 into play.
Fundamentals and Catalysts
The most recent hard numbers come from the company's quarterly filing. Walt Disney reported revenue of $25.25 billion for the quarter ended June 27, up 6.8% from $23.65 billion a year earlier, according to a Form 10-Q filed on August 5.
Profit moved the other way. Net income was $2.64 billion, compared with $5.26 billion a year earlier, and diluted earnings per share were $1.51, per the same filing reported on August 5. Revenue growth alongside lower net income is a mixed picture, and it explains why investors tend to watch the next report closely.
On the market side, Disney closed at $119.18 in a session reported on November 10, a gain of 2.08% from the previous day. The same November 10 report noted that investors will be watching the company's upcoming earnings disclosure. No date for that release appears in the research, so none is assumed here.
Macro, Political and Global Factors
The research gathered for this report contains no verified macro, policy or global facts relevant to Disney for the coming week. Rather than fill the gap with assumptions, this section is left to the price action: the stock's advance has come without a catalyst of that kind in the record.
Risks and What Would Invalidate the Scenario
The immediate risk is positioning. With the Stochastic oscillator at 84.8 and the price at 94% of its 20-day range, a stock this close to resistance can stall or pull back without any news. A rejection at 119.65 or 120.80 would leave it range-bound.
Volume is the second caution. Last week's average was 0.84 times the prior 20-day norm, so the advance has not yet drawn heavy buying.
The bullish case is invalidated by a break below 114.66. A drop under the SMA20 at 114.28 would also remove the main support for the uptrend. On the fundamental side, the profit decline from $5.26 billion to $2.64 billion in the June quarter, and the pending earnings disclosure, are the factors the research flags.
Technical Verdict for the Week: BUY
JournalArta's research model rates DIS BUY with a score of +68 on a scale from −100 to +100, where +60 or above is the buy threshold. This is technical analysis, not an investment recommendation.
The strongest reasons:
- Price at 118.97 is above the SMA50 at 109.20, and the 20-day average is above the 50-day average, confirming an uptrend.
- RSI at 66.9 sits in the 50–70 zone, showing strength without being overbought.
- MACD histogram of 0.391 is positive, and rising OBV supports the move.
The verdict is invalidated if the price falls below 114.66.
- Entry range: 117.07 – 118.97
- Target 1: 125.43
- Target 2: 131.90
- Stop loss: 114.66
- Reward/risk: 1.5 / 3.0, valid until December 12, 2026
In plain terms: the chart currently favors Disney's upside, but the stock is near a ceiling, and a slide below 114.66 would mean that view no longer holds.
DIS Week Ahead Data
| Trading week | November 9 – November 13 (5 sessions) |
| Weekly change | 1.90% (116.75 → 118.97 USD) |
| Week high / low | 120.44 (November 12) / 117.23 (November 9) |
| Best / worst session | 2.03% (November 9) / -1.19% (November 12) |
| Avg daily volume vs prior 20 sessions | 6,870,080 vs 8,223,040 (0.84x) |
| SMA20 / SMA50 | 114.28 / 109.20 |
| RSI (14) / Stochastic %K | 66.9 / 84.8 |
| Support / Resistance 20 days | 109.04 / 119.65 |
| 3-month high / low | 120.80 / 101.15 |
| Week covered | November 16–20, 2026 |
| Data as of | 14 November 2026 04:01 WIB |
| JournalArta research verdict (score) | Buy (+68) |
| Entry zone | 117.07 – 118.97 |
| Target 1 / 2 | 125.43 / 131.90 |
| Stop loss | 114.66 |
| Reward/risk | 1.5 / 3.0 |
Today's full Buy and Sell list for US stocks →
Disclaimer: This technical analysis is generated automatically from exchange data and indicators calculated by JournalArta, for information and education only. The verdict and the entry, target and stop-loss levels are not investment advice or a solicitation to buy or sell any security. Investment decisions and their risks rest solely with the reader.
Track DIS stock price daily: live levels, support/resistance and our full DIS analysis history.