CRWD Stock Week Ahead: Levels and Scenarios for November 16–20
CRWD stock week ahead for November 16–20: last close 226.61 USD, weekly change 4.48%, support 216.90, resistance 268.02.

CrowdStrike (CRWD) heads into the week of November 16–20 at $226.61, having closed Friday's November 13 session down 1.42% from a previous close of $229.87. The stock sits below both its 20-day and 50-day averages, and a fresh death cross is in place. Even so, it finished the week higher, and that tension frames the days ahead.
Last Week in Review
On the weekly figures, CRWD gained 4.48% in the five sessions from November 9 to November 13, closing at $226.61 against $216.90 on November 6. The stock opened the week at $219.85. The weekly high of $238.50 was set on November 11, a range of 10.29% from low to high.
The week faded into the close. The worst session was Friday, November 13, at -1.42%, leaving the stock at 47% of the week's range. Three sessions rose and two fell. Volume was light: the daily average of 6,963,040 shares was only 0.71 times the 20-session average before the week. A rebound on thin trading is generally treated with more caution than one on heavy volume.
Technical Map for the Week Ahead
The 20-day average (SMA20) is at $239.99 and the 50-day (SMA50) at $244.92, with the price below both. The SMA20 crossed below the SMA50 four sessions before the last one, forming a death cross, a pattern some traders read as a shift toward weaker momentum. The slope of the SMA20 is -2.15% over five days, which describes the average itself, not the stock's price change. The trend reads as a downtrend.
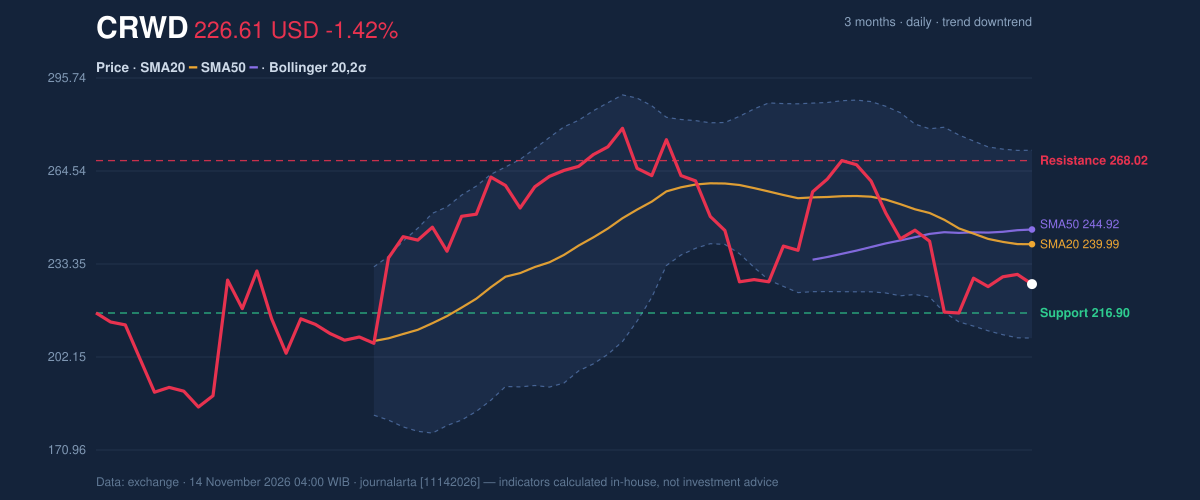
The 20-day range runs from support at $216.90 to resistance at $268.02, with the price sitting at 19% of that span. Over three months, CRWD has traded between $181.24 and $286.99. The Bollinger bands (20, 2σ) are $271.48 above and $208.51 below, around a middle of $239.99; the stock sits at 29% of the band, and the bands are widening, a sign of high volatility. The average true range is $14.84, or 6.5% of the price.
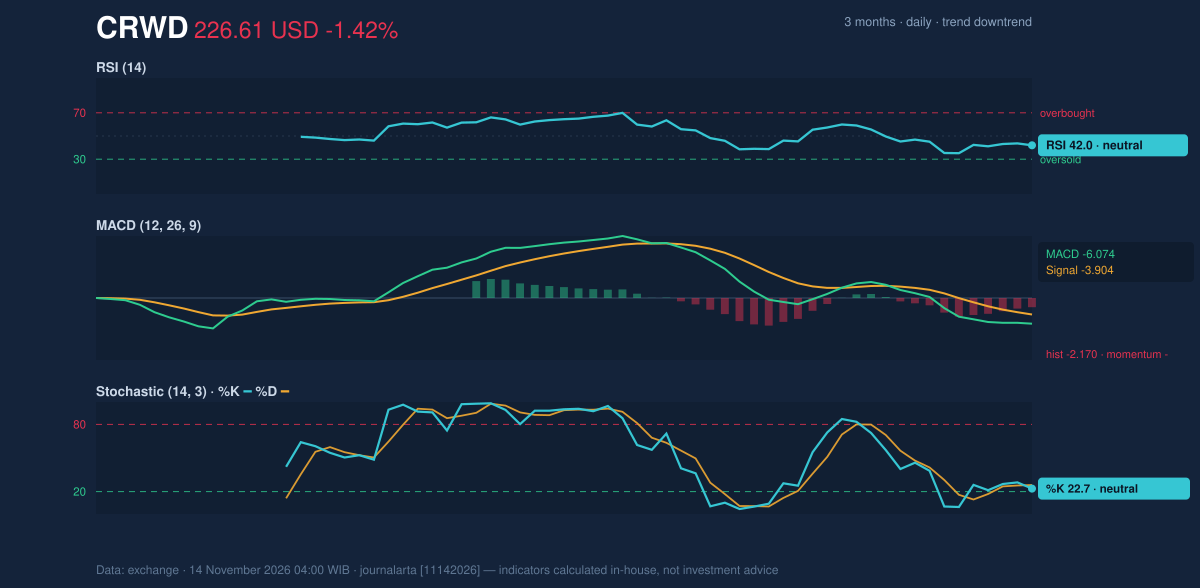
Momentum indicators lean soft. The Relative Strength Index (RSI), which gauges the speed of recent moves on a 0–100 scale, reads 42.0, neutral. The Stochastic reading is 22.7 (%K) and 25.9 (%D), also neutral. The MACD line is -6.074 against a signal of -3.904, a histogram of -2.170 that signals negative momentum. On-balance volume is falling.
Bullish scenario: if the stock breaks above its SMA20 at $239.99 and then the SMA50 at $244.92, the bounce would begin to reverse the death cross's message, with the Bollinger middle band and the week's high of $238.50 as the first hurdles. Bearish scenario: if it slips below the 20-day support at $216.90, which is near the week's low of $216.25, the next marker is the lower Bollinger band at $208.51.
Fundamentals and Catalysts
In its Form 10-Q filed on August 27, CrowdStrike reported quarterly revenue of $1.47 billion for the quarter ended July 31, up 25.8% from $1.17 billion a year earlier. Net income was $5.3 million, compared with a net loss of $70.2 million a year earlier, and diluted earnings per share were $0.01.
More recent news centers on artificial intelligence. Reported on November 12, the company rolled out a wave of AI-focused security products and integrations spanning sovereign cloud deployments, autonomous adversary testing, AI agent controls and partnerships across AWS, Dell, Dynatrace, Anthropic and others. Coverage published the same day said this may deepen module adoption under Falcon Flex and reinforces the company's push to secure enterprise AI agents at scale. Separate commentary the same day looked at how the Falcon Guardian and SafeMind expansion affects the investment narrative.
On November 13, it was reported that founder and CEO George Kurtz is looking beyond Anthropic, calling out the potential for the end of the world in its heavily dissected IPO prospectus. How the market weighs these items against a stock in a technical downtrend is not settled by the research.
Macro, Political and Global Factors
The research block for this week contains no macro, policy or global facts tagged to CrowdStrike, so none are cited here. No scheduled earnings date or other event for November 16–20 appears in the research either.
Risks and What Would Invalidate the Scenario
For the bearish technical picture, the key risk is a reversal above the SMA20 at $239.99, and more decisively the stop level of $251.85, which sits above the SMA50. The week's high of $238.50 shows the stock has already tested the area below the SMA20. Thin volume, at 0.71 times its recent average, cuts both ways: it weakens the case that last week's rally had conviction, but it also means a pickup in trading could move the price sharply. With the ATR at 6.5% of the price, daily swings can be large.
Company news is a separate risk. AI-security announcements dated November 12 and the Anthropic-related coverage dated November 13 are the latest items in the research, and their effect on sentiment is not captured by the indicators above.
Technical Verdict for the Week: SELL
JournalArta's research model scores CRWD at -74 on a −100 to +100 scale, in the sell range (−60 or below), with 0 bullish and 3 bearish technical signals. The main reasons:
- Death cross: the SMA20 ($239.99) crossed below the SMA50 ($244.92), and the price is under both.
- Bounce within a downtrend: the move into the SMA20 came with falling on-balance volume and a MACD histogram of -2.170.
- Weak participation: last week's gain came on volume 0.71 times the average.
Levels from the research model, valid until December 12, 2026:
- Entry range (sell zone): $226.61 – $237.74
- Target 1: $188.75
- Target 2: $150.89
- Stop loss: $251.85
- Reward/risk: 1.5 to target 1, 3.0 to target 2
The verdict is invalidated if the price breaks above $251.85. This is technical analysis, not an investment recommendation, and the site disclaimer applies.
In plain terms: the charts show a stock that bounced last week but remains in a downtrend, and the technical signals point to weakness unless it climbs back above roughly $252.
CRWD Week Ahead Data
| Trading week | November 9 – November 13 (5 sessions) |
| Weekly change | 4.48% (216.90 → 226.61 USD) |
| Week high / low | 238.50 (November 11) / 216.25 (November 9) |
| Best / worst session | 5.38% (November 9) / -1.42% (November 13) |
| Avg daily volume vs prior 20 sessions | 6,963,040 vs 9,763,710 (0.71x) |
| SMA20 / SMA50 | 239.99 / 244.92 |
| RSI (14) / Stochastic %K | 42.0 / 22.7 |
| Support / Resistance 20 days | 216.90 / 268.02 |
| 3-month high / low | 286.99 / 181.24 |
| Week covered | November 16–20, 2026 |
| Data as of | 14 November 2026 04:00 WIB |
| JournalArta research verdict (score) | Sell (-74) |
| Sell zone | 226.61 – 237.74 |
| Target 1 / 2 | 188.75 / 150.89 |
| Stop loss | 251.85 |
| Reward/risk | 1.5 / 3.0 |
Today's full Buy and Sell list for US stocks →
Disclaimer: This technical analysis is generated automatically from exchange data and indicators calculated by JournalArta, for information and education only. The verdict and the entry, target and stop-loss levels are not investment advice or a solicitation to buy or sell any security. Investment decisions and their risks rest solely with the reader.
Track CRWD stock price daily: live levels, support/resistance and our full CRWD analysis history.