Evolution Mining Share Price Tumbles 7.33%: Trading Volume 1.7x Normal
Technical analysis of Evolution Mining stock on November 19, 2026: price 10.88 AUD, trend sideways, RSI 34.0, support 10.88, resistance 14.00.

Why Evolution Mining is in focus today
- One-day move of 0.00%, about 0.0× its average daily range (ATR)
- Volume at 0.0× the 20-day average
Selected automatically from 8 ASX (Australia) stocks by a technical-signal score with daily weighted randomisation — not a recommendation.
Trend & Price Action
Evolution is trading below both its 20-day average at 12.34 and its 50-day average at 12.79, and the 20-day average itself slipped 0.30% over the past five sessions, a gentle downward tilt rather than a collapse. No fresh moving-average cross has formed, which is worth pausing on: the structure has been deteriorating quietly for weeks, and the violence of Thursday's session is the market catching up to a trend that was already leaning lower. The price sits at the very bottom of its 20-session range, with resistance at 14.00 and support at the current level. A close at 0% of range is a statement — buyers have not defended anything yet.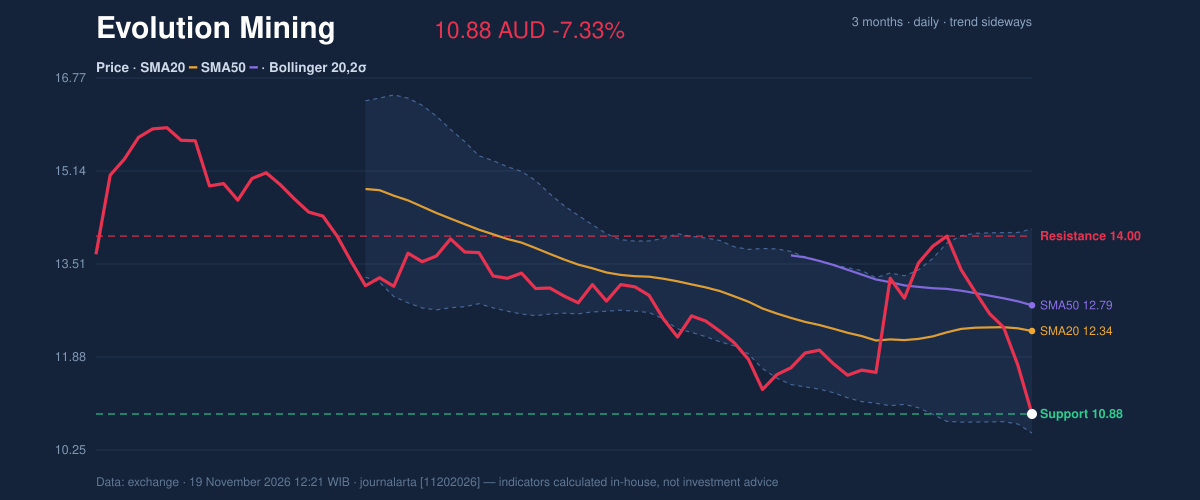
Oscillators & Momentum
The momentum readings are divided, and that division is informative. RSI(14) at 34.0 sits in the neutral band but in its lower half, not yet at the 30 threshold that would flag outright oversold conditions. Stochastic, by contrast, has already broken down hard — %K at 5.5 against %D at 19.0 — the kind of reading that typically precedes a short-term bounce or at least a pause. MACD offers no such comfort. At -0.157 against a signal line of -0.036, the histogram has just turned negative at -0.121, confirming that the intermediate trend has shifted against the stock rather than merely wobbling. When a fast oscillator screams oversold while MACD freshly deteriorates, the usual resolution is not a clean reversal but a grind — relief rallies that fail, or sideways drift that lets the averages catch down to price. None of the seven technical signals tracked by JournalArta's code are bullish; two are bearish, including a close below the 20-day low on volume at least 1.5 times average.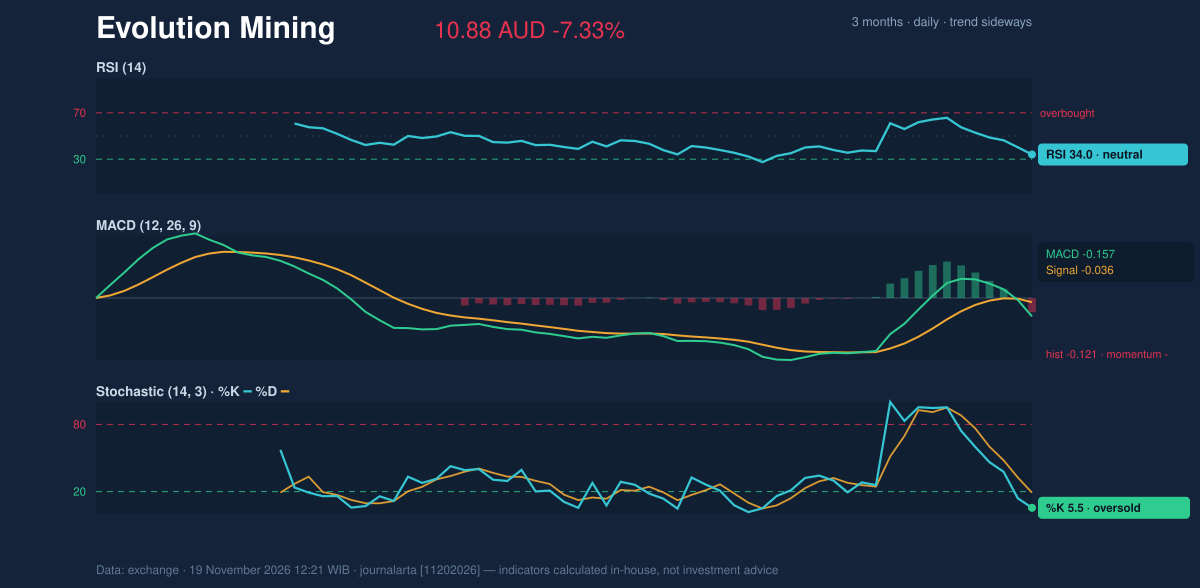
Volatility & Volume
Bollinger bands have widened to 29.0% of price, a signature of high volatility now being realised rather than merely feared. The %B reading of 9% places the close almost against the lower band at 10.55, with the upper band far away at 14.13 — the price is hugging the floor of the envelope, and in a widening band that is where continuation, not mean reversion, tends to occur. ATR(14) of 0.68, or 6.3% of the share price, underscores how large the daily swings have become; position sizing is a different exercise in this regime. On-balance volume is falling, confirming that the heavy turnover represents distribution rather than accumulation.Key Levels & Scenarios
The immediate test is the 10.88 support. A decisive break below it opens the path toward the three-month low of 10.69 and, beyond that, the deeper levels marked in JournalArta's computed list. A hold above 10.88 would not repair the trend on its own — the 20-day average at 12.34 remains the first real ceiling — but it would buy time and allow the oversold stochastic to work off. The stocks sits at an inflection where the technical case is unusually clean: below both averages, negative MACD, falling OBV, and a close on support with heavy volume.Technical Verdict: SELL
The call is SELL, consistent with JournalArta's computed score of -71 on a -100 to +100 scale, driven by price below the 50-day average, two bearish signals against zero bullish, the 20-day average beneath the 50-day, and RSI in the 30–50 zone. - Sell zone: 10.88 – 11.39 - Exit target 1: 9.14 - Exit target 2: 7.40 - Stop loss: 12.04 - Reward/risk: 1.5 / 3.0; setup valid until 17 Dec 2026. The verdict would be invalidated if price breaks and holds above 12.04, which would put the stock back through the 20-day average and undermine the bearish structure. The strongest counter-argument is the oversold stochastic at %K 5.5 — a sharp relief rally is entirely possible and is precisely why the stop sits where it does. In plain English: the miners are under pressure, the selling came with real volume, and the technical picture points down until the price can climb back above its short-term averages.Summary Data Evolution Mining
| Last price | 10.88 AUD |
| Change 1 day / 5 days / 1 month | -7.33% / -18.87% / -8.11% |
| Trend / MA-cross | sideways / none |
| SMA20 / SMA50 | 12.34 / 12.79 |
| RSI (14) / Stochastic %K | 34.0 / 5.5 |
| Bollinger %B / ATR | 9% / 0.68 |
| Support / Resistance 20 days | 10.88 / 14.00 |
| Data as of | 19 November 2026 12:21 WIB |
| JournalArta research verdict (score) | Sell (-71) |
| Sell zone | 10.88 – 11.39 |
| Target 1 / 2 | 9.14 / 7.40 |
| Stop loss | 12.04 |
| Reward/risk | 1.5 / 3.0 |
Today's full Buy and Sell list for Australian stocks (ASX) →
Disclaimer: This technical analysis is generated automatically from exchange data and indicators calculated by JournalArta, for information and education only. The verdict and the entry, target and stop-loss levels are not investment advice or a solicitation to buy or sell any security. Investment decisions and their risks rest solely with the reader.
Track Evolution Mining share price daily: live levels, support/resistance and our full Evolution Mining analysis history.
 Take the quizWhat Kind of Holiday Spender Are You? Take the Black Friday QuizStart →
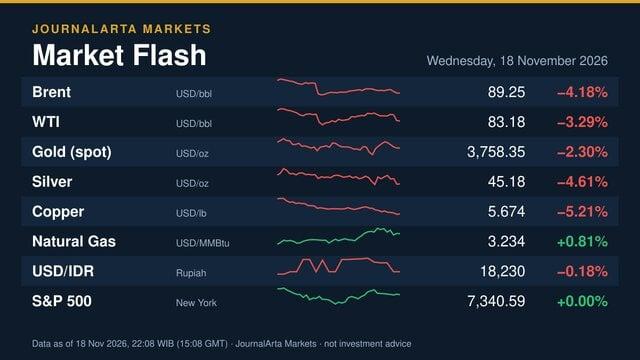
- 1Brent Crude Slides 4.05% as Rising US Stockpiles Weigh on Oil
- 2UnitedHealth Shares Fall 10.2% Amid Medicare Audit Proposal

- 3PNB Shares Rally 5% as Bank Repeats Loan Growth Target

- 4Stock Market Today: Nasdaq and S&P 500 Futures Rise Ahead of Anthropic Debut

- 5Lainey Wilson and Devlin Hodges Married in Tennessee Cave

 Lifestyle · Food & HealthWhat Is Raynaud’s Syndrome? Why Fingers Turn White in the Cold
 Lifestyle · Food & Health4 Ways Walking After Meals Helps Your Body, Doctors Say
 Lifestyle · Food & Health4 Reasons to Eat Oatmeal, According to Nutrition Experts
 Lifestyle7 Signs Your Social Battery Is Running Low (and Why You Keep Cancelling Plans)