Diageo Share Price Technicals: Rises 0.82% on Tuesday, Testing Key Resistance
Technical analysis of Diageo stock on November 10, 2026: price 1,895.50 GBp, trend uptrend, RSI 68.5, support 1,701.50, resistance 1,895.50.

Why Diageo is in focus today
- Closed at a 20-day high (1,895.50)
- Trading near its 3-month high (1,915.00)
- Uptrend confirmed (5-day change 7.52%)
- Not covered by JournalArta in the last 14 days
Selected automatically from 98 LSE (UK) stocks by a technical-signal score with daily weighted randomisation — not a recommendation.
Trend & Price Action
Diageo is above both its 20-day simple moving average, at 1,787.85, and its 50-day average, at 1,691.58. The shorter average is also above the longer one, while the 20-day average rose 3.14% over five days. Together, those readings point to an established upward trend rather than a single-session jump. No new moving-average crossover was recorded, so the trend signal comes from the existing price and average structure. The shares are at the top of the stated 20-session range and near their three-month high of 1,915.00. That strength can attract further attention, but it also leaves less room before the next visible historical ceiling. The Bollinger %B reading is 100%, meaning price is at the upper band; with the bands at 1,680.63 and 1,895.07, this reinforces the picture of a strong advance while warning that the price is pressing against a short-term boundary. The trend is positive, but the close at the range ceiling makes follow-through more important than the size of the recent rise. As shown in the chart, the shares are above their moving averages and at the upper Bollinger band, with resistance aligned to the latest close.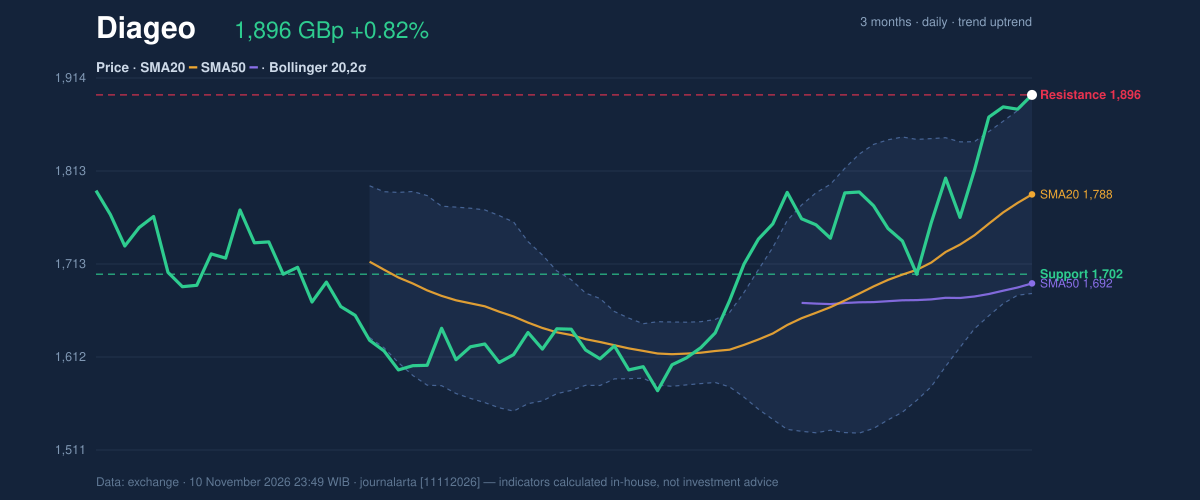
Oscillators & Momentum
Momentum indicators broadly support the upward move. MACD is 50.394 against a signal line of 38.517, leaving a positive histogram of 11.877. In plain terms, the faster momentum measure remains above its comparison line, consistent with upward pressure. RSI is 68.5, still in the supplied neutral classification but close to the 70 threshold often associated with an overbought reading. Stochastic tells a more cautious short-term story: %K is 91.2 and %D is 88.8, both in overbought territory. That does not by itself establish a reversal; it means the shares have advanced quickly enough that a pause or pullback would be plausible. The contrast between positive MACD and high Stochastic suggests the broader momentum remains constructive, while near-term conditions are stretched. MACD remains positive, while Stochastic at 91.2/88.8 flags elevated short-term momentum. The chart below places RSI, MACD and Stochastic readings alongside one another, making the difference between trend support and near-term extension clearer.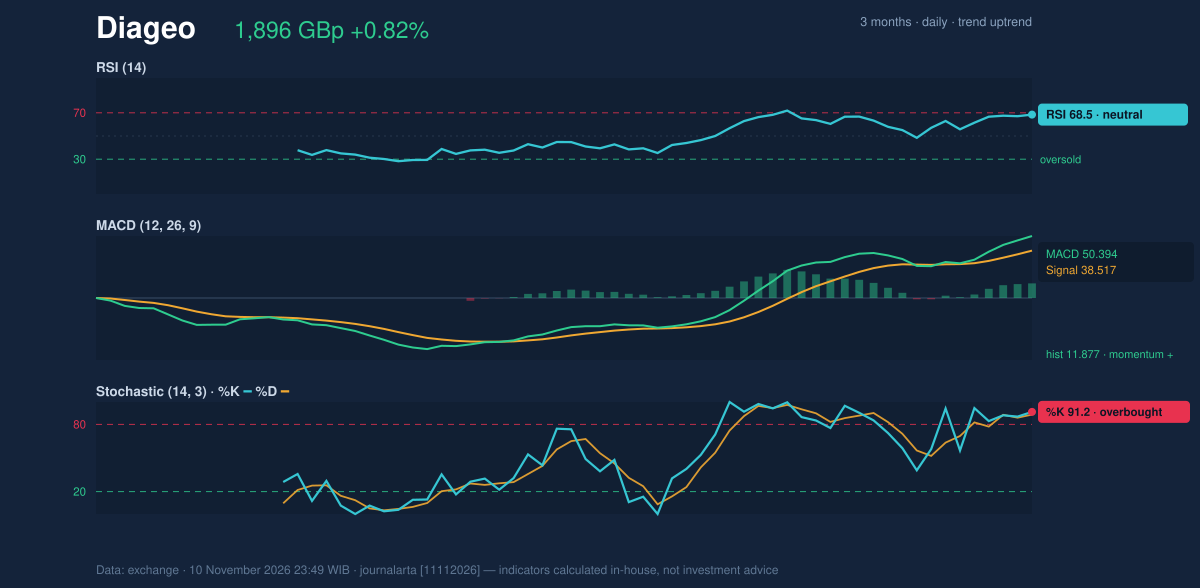
Volatility, Volume & Key Levels
Trading volume was 5,579,123 shares, about 1.2 times the 20-session average of 4,544,484, while OBV was rising. That combination suggests the advance has participation behind it rather than relying solely on thin trading. Average true range, a measure of typical price movement, was 51.04 GBp, or 2.7% of the share price, indicating moderate volatility. The supplied 20-session support is 1,701.50, while resistance is 1,895.50. A sustained move beyond the resistance area would put the three-month high of 1,915.00 in focus; failure to hold the entry-zone area could instead expose the trend to a setback. The research verdict levels below use the specified entry, targets and stop.Technical Verdict: BUY
JournalArta’s technical model assigns Diageo a BUY verdict with a score of +68. The strongest supporting signals are the price above its 50-day average, the 20-day average above the 50-day, and rising OBV confirming the uptrend. RSI at 68.5 remains within the model’s stated 50–70 momentum zone, although the elevated Stochastic readings are a near-term risk. The verdict is invalidated if the price falls below the specified stop-loss level of 1,808. - Ideal entry range: 1,858–1,895 GBp - Exit targets: Target 1 at 2,025 GBp; Target 2 at 2,156 GBp - Stop-loss protection: 1,808 GBp - Model validity: Until December 8, 2026 For non-traders, the verdict means the technical signals favour the rising trend, but a retreat below the defined stop would undermine that reading. | Market measure | Reading | |---|---:| | Last price | 1,895.50 GBp | | One-day change | +0.82% | | Five-day change | +7.52% | | One-month change | +10.69% | | SMA20 / SMA50 | 1,787.85 / 1,691.58 | | RSI / Stochastic | 68.5 / 91.2 and 88.8 | | MACD / signal / histogram | 50.394 / 38.517 / 11.877 | | ATR / volume ratio | 51.04 / 1.2× normal |Summary Data Diageo
| Last price | 1,895.50 GBp |
| Change 1 day / 5 days / 1 month | 0.82% / 7.52% / 10.69% |
| Trend / MA-cross | uptrend / none |
| SMA20 / SMA50 | 1,787.85 / 1,691.58 |
| RSI (14) / Stochastic %K | 68.5 / 91.2 |
| Bollinger %B / ATR | 100% / 51.04 |
| Support / Resistance 20 days | 1,701.50 / 1,895.50 |
| Data as of | 10 November 2026 23:49 WIB |
| JournalArta research verdict (score) | Buy (+68) |
| Entry zone | 1,858 – 1,895 |
| Target 1 / 2 | 2,025 / 2,156 |
| Stop loss | 1,808 |
| Reward/risk | 1.5 / 3.0 |
Today's full Buy and Sell list for UK, Singapore & Hong Kong stocks →
Disclaimer: This technical analysis is generated automatically from exchange data and indicators calculated by JournalArta, for information and education only. The verdict and the entry, target and stop-loss levels are not investment advice or a solicitation to buy or sell any security. Investment decisions and their risks rest solely with the reader.
Track Diageo share price daily: live levels, support/resistance and our full Diageo analysis history.