ServiceNow (NOW) Stock Climbs 3.16%: Down 26.6% in a Month
Technical analysis of NOW stock on November 11, 2026: price 102.76 USD, trend downtrend, RSI 31.0, support 99.61, resistance 158.96.

Trend & Price Action
The structure is firmly bearish. The price is below both the 20-day simple moving average (SMA20) at 128.29 and the 50-day average (SMA50) at 133.69. A moving average is just the mean closing price over a set number of sessions, so a price this far beneath both says recent buyers are mostly underwater. More telling is the crossover. A death cross, where the shorter average cuts below the longer one, formed four sessions before the latest session. It is not a signal that appeared today, but it is recent. The 20-day average fell 6.90% over five days, a measure of how quickly the trend's centre of gravity is sinking, not of the stock's own price change. As shown in the chart, price now hugs the lower part of its range, between the 20-day support at 99.61 and the 3-month low of 97.00.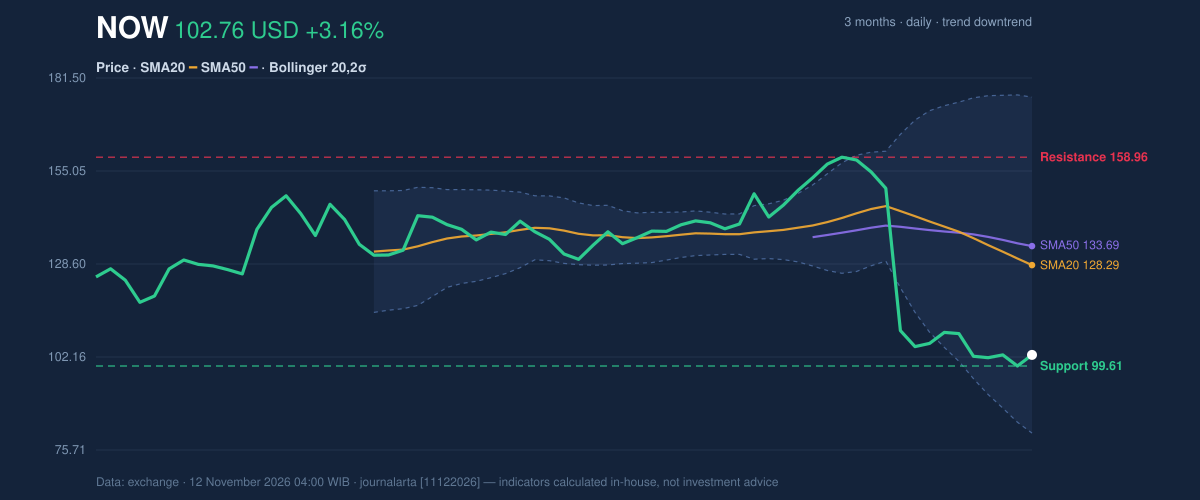
Oscillators & Momentum
Momentum indicators tell the same story, with one nuance. The 14-day Relative Strength Index (RSI) reads 31.0, classed as neutral but sitting just above the 30 threshold that traders treat as oversold. The Stochastic oscillator, which compares the close with the recent high-low range, is more extreme: %K at 9.2 and %D at 5.7, both firmly oversold. Oversold readings mean the selling has been one-directional and stretched. They do not mean a rebound is due. In a confirmed downtrend, oscillators can stay pinned low for long periods. The MACD, which tracks the gap between short- and long-term momentum, is at -10.811 against a signal line of -7.326, leaving a histogram of -3.485. The negative histogram widening means downward momentum was still building, not fading, even as the stock ticked up on Wednesday.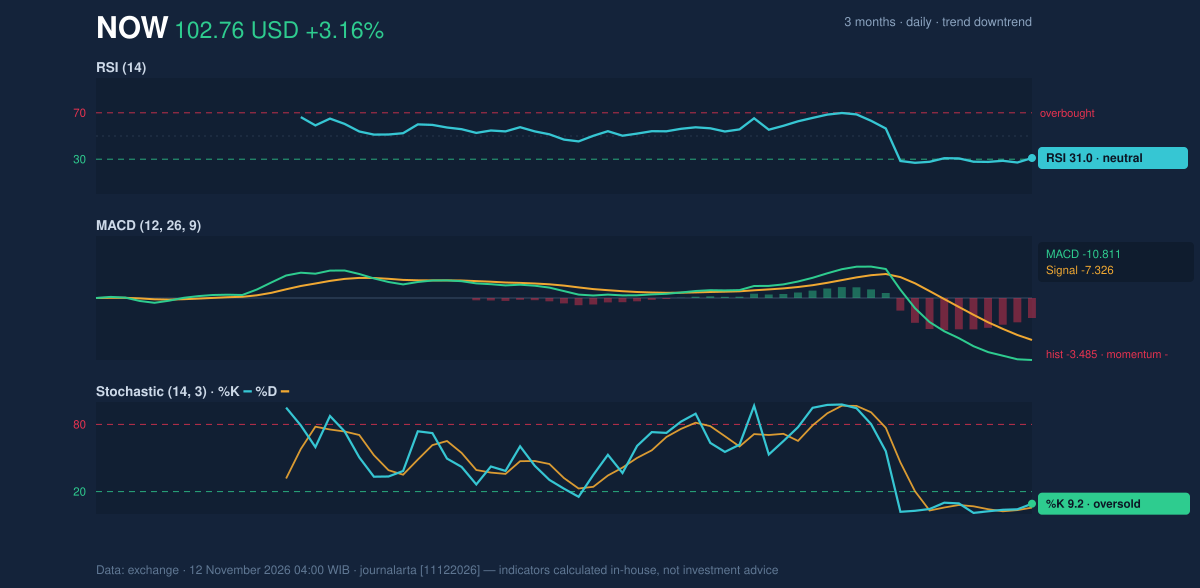
Volatility & Volume
Bollinger Bands, which draw a channel two standard deviations around the 20-day average, are wide: the upper band is 176.07, the lower 80.52, a width of 74.5% and widening. The %B reading of 23% places the price in the lower quarter of that channel. Wide, expanding bands signal high volatility, and the ATR(14) of 7.70, or 7.5% of the share price, confirms that daily swings are large. Volume adds a cautionary note. Wednesday's turnover was 14,481,600 shares, only 0.7 times the 20-day average of 20,485,980. A rebound on below-average volume suggests limited conviction among buyers. On-balance volume (OBV), which adds volume on up days and subtracts it on down days, is falling, so more of the recent trading has been behind declines than advances.Fundamental Context
The selloff contrasts with the company's latest filings. According to its SEC filing (Form 10-Q, filed October 28, 2026), ServiceNow reported quarterly revenue of $4.11 billion for the quarter ended September 30, up 20.5% from $3.41 billion a year earlier. Net income was $277.0 million, compared with $502.0 million a year earlier, and diluted earnings per share were $0.27. Revenue growth is strong, but profit fell sharply year on year, a gap the market may be weighing. The technical verdict below rests on price action, not on these figures.Key Levels & Scenarios
The levels that matter come straight from the data. The 20-day support at 99.61 is also Tuesday's close, and the 3-month low at 97.00 sits just beneath it. A close below 99.61 would break the support and expose the 97.00 low, and then the volatility-based level of 91.20 (price minus 1.5 times ATR). On the upside, the 1.5×ATR level at 114.32 is the first reference point, and a close above the 20-day resistance at 158.96 would be needed to challenge the downtrend outright, a distant prospect from here.Technical Verdict: HOLD (wait & see)
JournalArta's research board scores NOW at -76 on a −100 to +100 scale, short of the +60 Buy and −60 Sell thresholds. The stop would sit too far from price, so the call stays on Hold.
Why NOW is in focus today
- One-day move of 0.00%, about 0.0× its average daily range (ATR)
Selected automatically from 7 NYSE (US) stocks by a technical-signal score with daily weighted randomisation — not a recommendation.
- Upside scenario: a close above the 20-day resistance at 158.96.
- Downside scenario: a break below the 20-day support at 99.61.
In plain terms: NOW has no clear direction yet; 158.96 and 99.61 are the levels that decide the next move.
Summary Data NOW
| Last price | 102.76 USD |
| Change 1 day / 5 days / 1 month | 3.16% / -5.56% / -26.59% |
| Trend / MA-cross | downtrend / death |
| SMA20 / SMA50 | 128.29 / 133.69 |
| RSI (14) / Stochastic %K | 31.0 / 9.2 |
| Bollinger %B / ATR | 23% / 7.70 |
| Support / Resistance 20 days | 99.61 / 158.96 |
| Data as of | 12 November 2026 04:00 WIB |
| JournalArta research verdict (score) | Hold (-76) |
Today's full Buy and Sell list for US stocks →
Disclaimer: This technical analysis is generated automatically from exchange data and indicators calculated by JournalArta, for information and education only. The verdict and the entry, target and stop-loss levels are not investment advice or a solicitation to buy or sell any security. Investment decisions and their risks rest solely with the reader.
Track NOW stock price daily: live levels, support/resistance and our full NOW analysis history.