76.90 HKD is pressing right up against the Bollinger upper band at 76.92 and just below 20-hour resistance at 76.95, while AIA Group’s 1299.HK chart still reads as a sideways trend rather than a clean breakout. The move is notable because the stock is holding above SMA20 at 73.58, yet it remains below SMA50 at 77.77, a positioning that often signals a market still deciding whether recent strength is a pause inside a range or the start of a larger turn.
Trend & Price Action
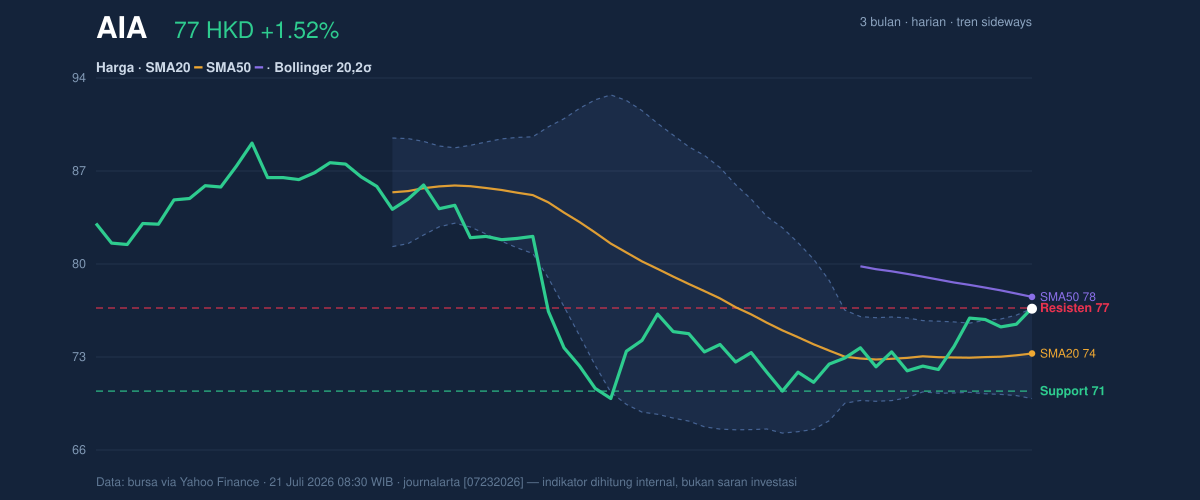
AIA’s latest price action, as shown in the chart, is tight and unusually compressed at the top of its short-term range. The stock closed at 76.90 HKD, up 1.52% on the day and 3.78% over 5 days, which tells us buyers have been active enough to keep price elevated near resistance. But the broader structure has not yet escaped the range. The stated trend is sideways, and the SMA20 slope of 0.40% over 5 days suggests only a mild upward tilt, not a decisive trend acceleration.
That matters because price is sitting between two important moving averages. Trading above SMA20 usually shows the short-term tone has improved. Trading below SMA50 means the medium-term trend has not fully confirmed that improvement. In plain terms, the stock has recovered, but it has not yet proved that recovery can extend beyond the next ceiling.
The range positioning is also important. With support at 70.80 and resistance at 76.95, the price is now at 99% of the range. That is a technical warning as much as a signal of strength. When a stock is this close to the top of its band, the market is saying one of two things: either it is preparing to break out, or it is running out of room and may need to cool off first.
3-month price action chart of AIA: price, SMA20/50, Bollinger, support & resistance. Data: exchange via Yahoo Finance.
Oscillators & Momentum
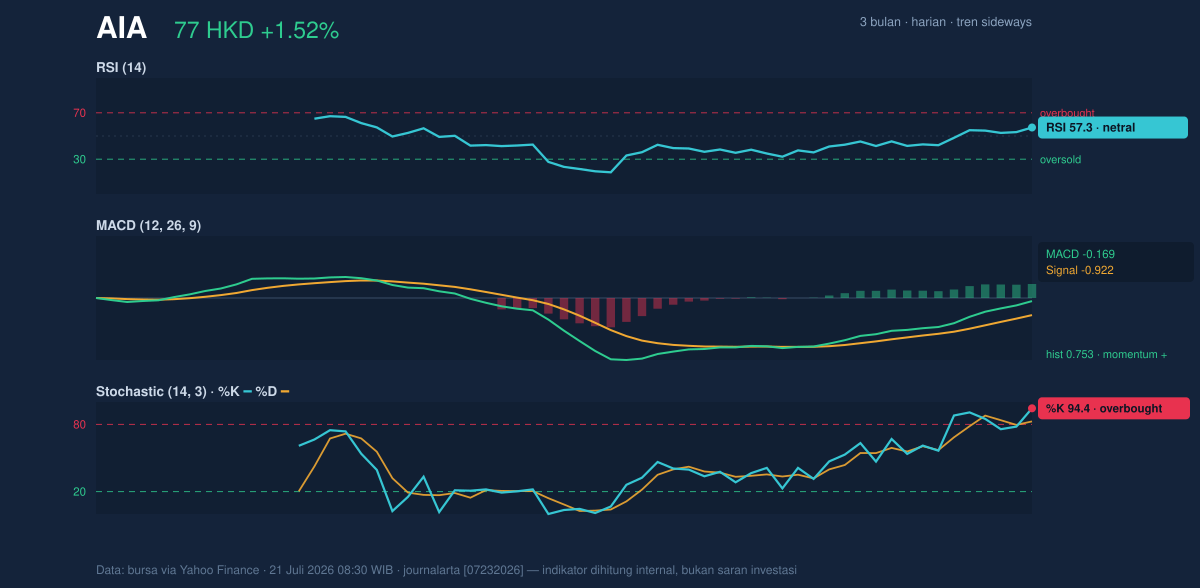
The momentum picture is mixed, and that tension is the most important read in the data. The RSI at 57.3 is neutral, which means the stock is not stretched in the classic momentum sense. That leaves room for further upside if buyers keep control. But the stochastic oscillator is much hotter: %K at 94.4 and %D at 82.7 place the stock in overbought territory. As shown in the chart, that usually does not mean an immediate reversal, but it does mean the short-term rally is getting crowded and may be vulnerable to pauses or pullbacks.
The MACD adds a more constructive layer. MACD at -0.169 is still slightly below zero, but the signal line at -0.922 and histogram at 0.753 show positive momentum is building beneath the surface. In practical terms, the MACD is telling readers that downside pressure has weakened and the stock is moving toward a more favorable momentum setup, even if it has not fully crossed into a strong trend regime yet.
That combination is why the chart feels balanced rather than euphoric. The stochastic says the move is mature. The RSI says it is not exhausted. The MACD says momentum is improving. Those signals do not fully agree, which is typical when a stock is testing resistance after a short advance.
Momentum chart of AIA: RSI(14), MACD, Stochastic. Data: exchange via Yahoo Finance.
Volatility & Volume
Volatility is present, but not extreme. ATR(14) at 2.05, equal to 2.7% of price, suggests the stock can still move meaningfully in either direction without entering a panic phase. The Bollinger Bands are especially useful here. The band width is 9.1%, described as normal, which means this is not a squeeze setup where a sharp expansion is being telegraphed. Instead, price is already at the top of the structure, with %B at 100% showing it is touching the upper boundary. That often attracts short-term profit-taking unless fresh demand appears quickly.
Volume is the other caution flag. The latest volume was 17,396,996, below the 20-hour average of 26,649,342, or 0.7× normal. That means the push toward resistance has not yet been backed by strong participation. Price can still rise on lighter volume, but breakouts tend to be more convincing when turnover expands. The fact that OBV is rising helps offset that concern slightly, because on-balance volume is still showing net accumulation over time. Even so, the latest session’s lighter trading suggests conviction is not yet fully visible in the tape.
Key Levels & Scenarios
The immediate technical map is straightforward. 76.95 is the key ceiling, and 76.92 on the Bollinger upper band is effectively the same barrier. A clean close above that zone would indicate the stock is no longer merely testing the top of its range. On the downside, 73.58 is the first meaningful technical floor because it is both SMA20 and the Bollinger middle band. If that gives way, the stock would likely be signaling that the recent bounce is losing structure. The deeper floor is 70.80, which aligns with the stated support and would be the line that keeps the broader range intact.
The wider 3-month frame adds context. The stock has traded between 89.95 and 69.05, so current price remains well below the upper end of the recent span. That tells readers the market has repaired some of its weakness, but it has not yet reclaimed the more ambitious part of the range.
Technical Verdict: HOLD (wait & see)
HOLD (wait & see)
- Reason 1: Price is at 76.90 HKD, almost touching resistance at 76.95 and the Bollinger upper band at 76.92, which raises the odds of hesitation.
- Reason 2:MACD is positive on momentum with a 0.753 histogram, but Stochastic is overbought at 94.4 / 82.7, so short-term upside is not cleanly confirmed.
- Reason 3: Volume is only 0.7× normal, which weakens the credibility of the advance even though OBV is rising.
- Verdict invalidated if price breaks below 73.58, because that would mean the short-term base and the Bollinger midline have failed.
- Ideal Entry Range:73.58 to 75.00 HKD
- Exit Target:76.95 HKD
- Stop Loss protection:70.80 HKD
For non-traders, this means the stock looks healthier than it did, but it has not yet proved it can push through the next wall.