HSBC Stock Technicals Today: Gains 1.29%, Testing Key Resistance
Technical analysis of HSBC stock on Juli 15, 2026: price 1,490.00 GBp, trend uptrend, RSI 60.5, support 1,409.60, resistance 1,471.00. Key angle: HSBC Stock…

HSBC Holdings (HSBA.L) closed at 1,490.00 GBp in the latest session, reflecting a 1.29% gain that underscores the stock’s resilient climb over the past month. Trading volume remains measured at 0.9x the 20-day average, suggesting that the current upward trajectory is driven by steady conviction rather than frantic retail speculation. As the stock pushes beyond its previous resistance levels, the market is currently recalibrating its expectations for this global lender.
Trend and Structural Positioning
The structural integrity of HSBC’s current rally is supported by its positioning well above the key moving averages. With the price sitting at 1,490.00 GBp, it maintains a healthy distance from the SMA20 at 1,443.44 and the SMA50 at 1,389.06. This alignment confirms a stable uptrend, characterized by a 5-day slope of 2.17%.
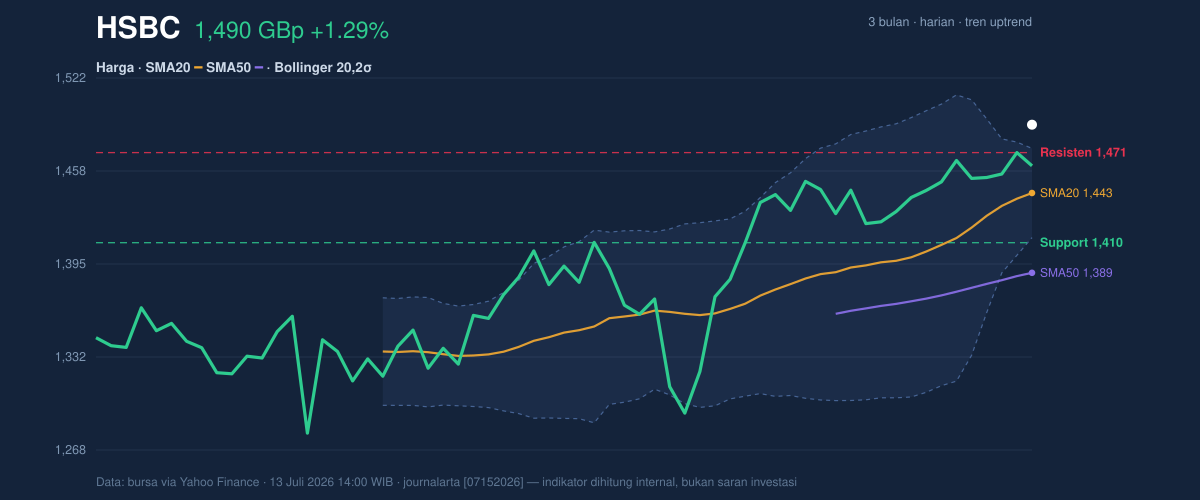
Notably, the price has breached the Bollinger Band upper limit of 1,473.84. When price pushes outside this band with a %B of 127%, it typically signals an extension that invites either a period of consolidation or an acceleration of momentum. The narrowing of the Bollinger bandwidth to 4.2% indicates a squeeze pattern, often a precursor to heightened volatility as the market decides the next directional breakout.
Oscillators and Momentum
The momentum profile of HSBC is currently in a state of delicate equilibrium. The RSI(14) at 60.5 keeps the stock in neutral territory—far from the overbought threshold of 70, leaving room for further upside without the immediate risk of a technical exhaustion pivot.
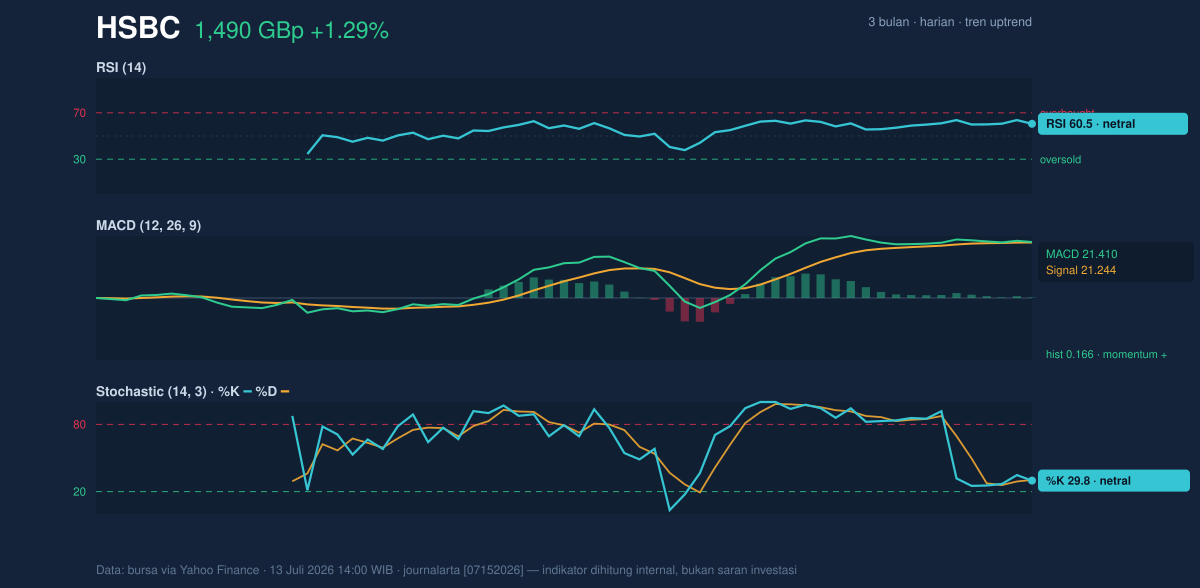
The MACD is displaying positive momentum with a reading of 21.410, just edging above its signal line at 21.244. While the histogram remains thin at 0.166, the fact that it is positive in conjunction with a rising On-Balance Volume (OBV) suggests that institutional participation is quietly accumulating rather than exiting the position. Meanwhile, the Stochastic %K at 29.8 indicates the stock is nearing a reset, providing a secondary confirmation that the recent push has not yet reached a level of extreme pricing.
Volatility and Key Thresholds
With an ATR(14) of 34.77, HSBC is experiencing moderate price swings, representing roughly 2.3% of its current valuation. This level of volatility suggests that the stock is moving with intent but is not currently prone to erratic, sentiment-driven gaps.
The immediate task for the stock is to prove that the former resistance of 1,471.00 GBp—the previous close and 20-day resistance—can now serve as a functional support level. Failure to hold this line would shift the focus back toward the SMA20, while sustained trade above 1,490.00 GBp invites a test of the 3-month high of 1,590.00 GBp.
Technical Verdict: HOLD (wait & see)
The current technical state is best described as an extended trend testing new territory.
* Rationale: The stock shows positive MACD momentum and a solid uptrend above SMA20/SMA50, yet the %B of 127% indicates it is currently extended beyond typical Bollinger volatility bands, suggesting a cooling-off period may be imminent before a sustained move higher.
* Verdict invalidated if: The price falls decisively below the 1,443.44 GBp level (SMA20), which would negate the current short-term momentum.
Technical Parameters:
* Ideal Entry Range: 1,445.00 – 1,460.00 GBp (seeking a retest of the Bollinger mean).
* Exit Target (Resistance): 1,590.00 GBp (3-month high).
* Stop Loss Protection: 1,405.00 GBp (below the 20-day support of 1,409.60).
Technical indicators suggest that while the trend is strong, the current price extension warrants patience to see if the stock establishes a firmer base above 1,470.00 GBp.
The next regulatory filing from the bank is expected on July 30, 2026.
Summary Data HSBC
| Last price | 1,490.00 GBp |
| Change 1 day / 5 days / 1 month | 1.29% / 1.66% / 7.61% |
| Trend / MA-cross | uptrend / none |
| SMA20 / SMA50 | 1,443.44 / 1,389.06 |
| RSI (14) / Stochastic %K | 60.5 / 29.8 |
| Bollinger %B / ATR | 127% / 34.77 |
| Support / Resistance 20 days | 1,409.60 / 1,471.00 |
| Data as of | 13 Juli 2026 14:00 WIB |



