Tencent Stock Analysis: Drops 0.87%, Momentum Gains
Technical analysis of Tencent stock on Juli 15, 2026: price 456.20 HKD, trend sideways, RSI 53.7, support 411.80, resistance 478.80. Key angle: Tencent Stock…

Tencent Holdings (0700.HK) shares closed at 456.20 HKD on the Hong Kong Stock Exchange, registering a marginal daily decline of 0.87% that reflects a broader period of consolidation. Despite the cooling sentiment, the stock remains positioned within a critical technical corridor, holding steady above key short-term moving averages even as market participation remains uncharacteristically thin.
Trend and Price Action
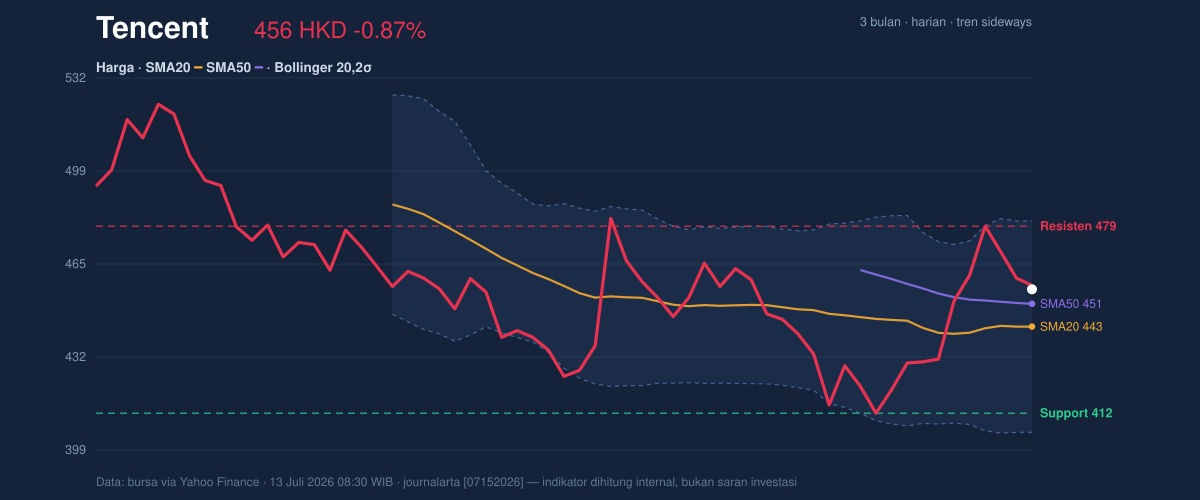
The stock is currently navigating a period of sideways movement, with the 5-day slope of the SMA20 resting at a modest 0.59%. Crucially, the price remains above both the SMA20 (442.84) and the SMA50 (451.01). While the absence of a recent moving average cross suggests a lack of immediate directional conviction, the ability to maintain these levels serves as a foundational buffer for investors. As the stock sits at roughly 66% of its 3-month range, it occupies the upper half of its recent trading channel, indicating that buyers are still defending territory above the 50-day average.
Oscillators and Momentum
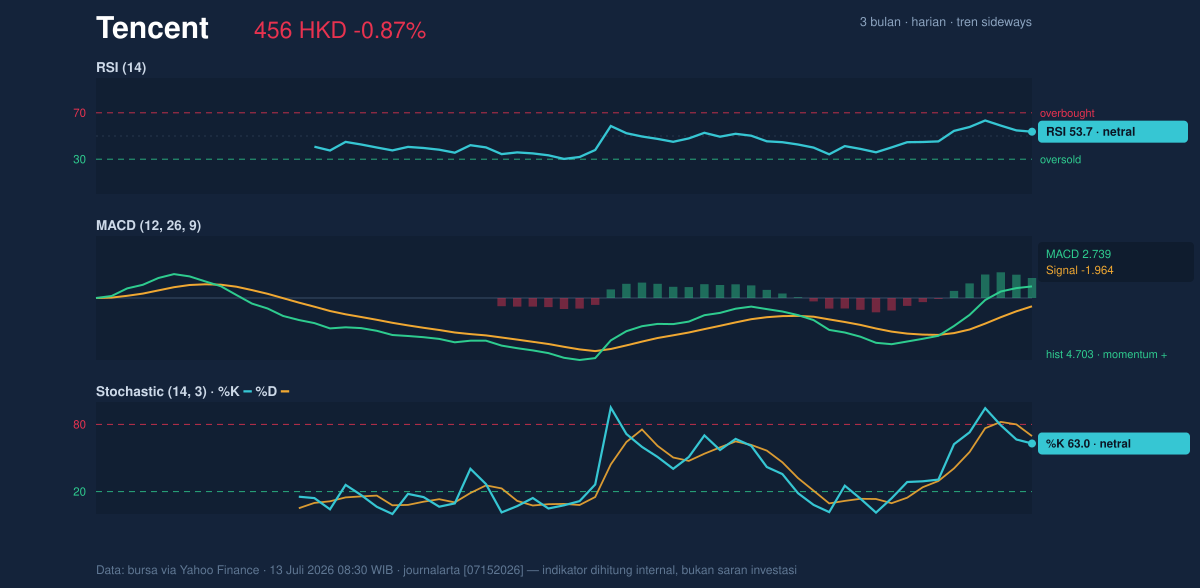
Momentum indicators present a picture of tempered equilibrium. The RSI(14) at 53.7 is firmly entrenched in neutral territory, devoid of the extreme enthusiasm associated with overbought conditions or the panic of oversold zones. Similarly, the Stochastic oscillator (%K 63.0 / %D 69.5) highlights a lack of urgency, with the %K trending just beneath the %D, signaling a minor pause in buying pressure. However, the MACD (2.739) remains above its signal line (-1.964) with a positive histogram (4.703). This divergence suggests that while the price action is drifting, the underlying momentum retains a subtle, positive bias.
Volatility and Volume
Tencent’s current market behavior is characterized by a "wait and see" approach from institutional participants. The volume of 24.29 million shares is notably low, tracking at roughly 0.7x of its 20-day average. When volume dries up in a range-bound environment, it typically suggests that the market is awaiting a specific catalyst before committing to a breakout or breakdown. Meanwhile, the Bollinger Band width of 17.1% indicates normal volatility, though the ATR(14) of 19.04—representing 4.2% of the stock price—warns that the stock remains prone to sharp, sudden intraday swings despite the overall calm.
Key Levels and Scenarios
The stock is effectively boxed between its support at 411.80 HKD and its resistance at 478.80 HKD. Should the price overcome the resistance barrier, it would likely signal a move toward the upper Bollinger Band of 480.73 HKD. Conversely, a failure to hold the SMA50 (451.01 HKD) would likely invite a test of the 442.84 HKD midline, placing the support floor at 411.80 HKD back into the focus of market participants.
Technical Verdict: HOLD (wait & see)
The technical stance for Tencent is a cautious hold, predicated on the following observations:
* Neutral Momentum: With both RSI and Stochastic indicators sitting in neutral zones, there is no immediate trigger for a directional trade.
* Support Resilience: The price's position above the SMA50 provides a defensive floor, but the low trading volume suggests that this support has not yet been tested by high-conviction institutional inflows.
* Verdict invalidated: The current neutral outlook is invalidated if the price breaks decisively above the 478.80 HKD resistance or falls below the 411.80 HKD support level.
Trade Parameters:
* Entry Range: 445.00 – 450.00 HKD
* Exit Target (Resistance): 478.00 HKD
* Stop Loss: 408.00 HKD
In plain terms, the stock is currently drifting in a holding pattern, and it is best to wait for a meaningful shift in volume or a breakout beyond its recent trading range before expecting a significant move.
*Disclaimer: This analysis is for informational purposes only and does not constitute financial or investment advice.*
Summary Data Tencent
| Last price | 456.20 HKD |
| Change 1 day / 5 days / 1 month | -0.87% / 0.93% / -0.22% |
| Trend / MA-cross | sideways / none |
| SMA20 / SMA50 | 442.84 / 451.01 |
| RSI (14) / Stochastic %K | 53.7 / 63.0 |
| Bollinger %B / ATR | 68% / 19.04 |
| Support / Resistance 20 days | 411.80 / 478.80 |
| Data as of | 13 Juli 2026 08:30 WIB |


