Momentum Gains, BP Stock Gains 0.53% Today
On Juli 16, 2026: price 507.70 GBp, trend sideways, RSI 58.5, support 455.60, resistance 516.50. technical analysis of bp stock. Key angle: Momentum Gains.

BP plc is currently navigating a pivotal juncture on the London Stock Exchange as investors weigh the company’s recent price appreciation against a backdrop of stagnating momentum. With the latest print at 507.70 GBp, the stock is currently attempting to shed its recent malaise, posting a 6.99% gain over the past five trading sessions.
Market participants are observing a tight tug-of-war between short-term optimism and underlying structural resistance.
Trend & Price Action
The stock is in a state of flux. While BP is currently trading at 507.70 GBp, placing it comfortably above its SMA20 (483.72 GBp), it remains trapped beneath the SMA50 (518.51 GBp). This position suggests a transition phase; the stock is no longer in a freefall but has yet to reclaim its medium-term bullish trajectory. The SMA20 slope of -1.76% over five days indicates that the current recovery is sharp but disconnected from the broader, more sluggish trend.
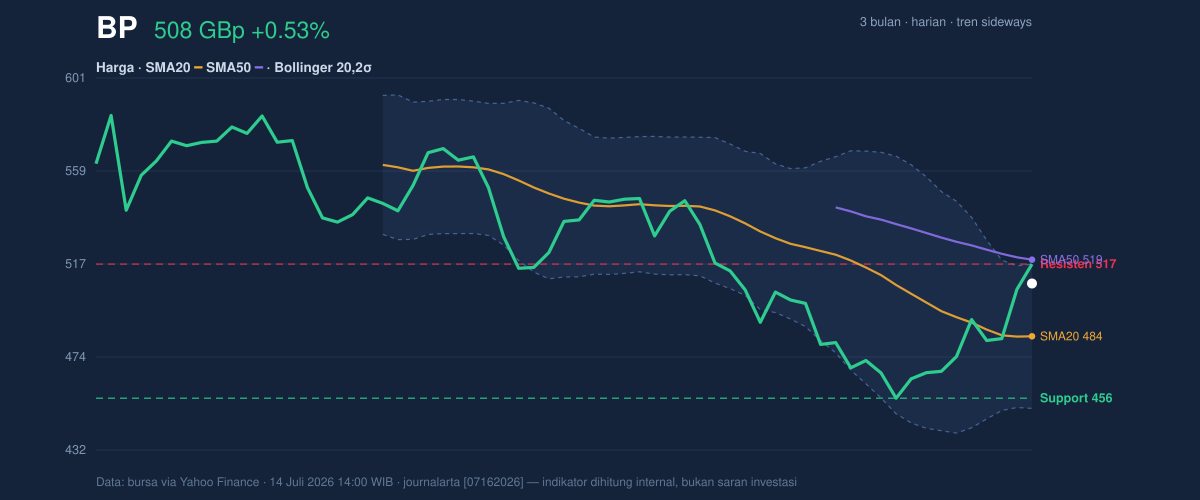
The price is currently situated at 86% of its recent 20-day range, pressing hard against the upper bound of its volatility structure.
Volatility & Volume
Volatility metrics offer a glimpse into the mechanics of this move. The Bollinger band upper limit sits at 516.50 GBp, which currently acts as the primary psychological ceiling for the stock. With a %B of 87%, BP is approaching "stretched" territory relative to its recent price action. However, the volume profile provides some comfort to those looking for stability: the latest volume of 43.43 million shares sits at roughly 1.0x the 20-day average, while the OBV (On-Balance Volume) is rising. This confirms that the recent price increase is supported by genuine market participation rather than thin, speculative trading.
Oscillators & Momentum
The momentum indicators present a warning to those chasing the current 0.53% daily rise. While the MACD sits at -7.143 with a positive histogram (6.521)—a classic signal that short-term momentum is building—the internal speed of the move is flashing caution. The RSI at 58.5 remains in neutral territory, yet the Stochastic %K at 92.9 is firmly in overbought terrain.
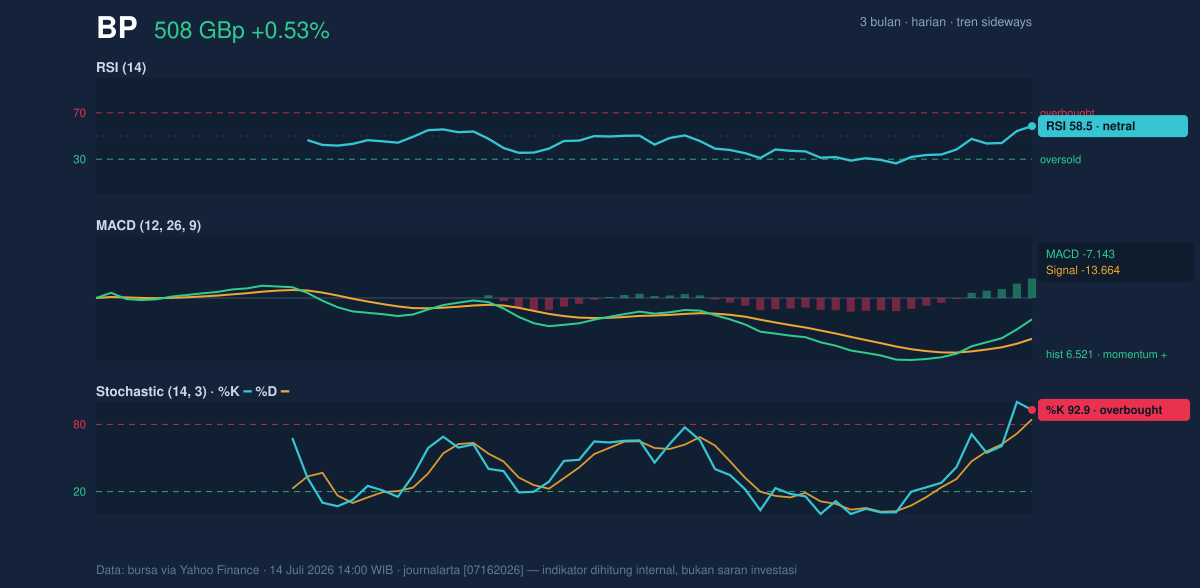
When the Stochastic oscillator enters this extreme zone, it suggests that the immediate "gas in the tank" for the current rally is nearly depleted, often preceding a consolidation or a localized pullback.
Key Levels & Scenarios
The battle line is clearly drawn at the 516.50 GBp resistance level. A clean break above this threshold, backed by volume, would signal a potential test of the 520.00 GBp area and a challenge to the SMA50. Conversely, failure to sustain momentum above 500.00 GBp could invite a retest of the 483.72 GBp (SMA20) support level. Given the current ATR of 11.88, traders should expect daily price swings of approximately 2.3%, a normal range that keeps the current trend within manageable bounds.
Technical Verdict: HOLD
* Overbought conditions: Stochastic %K (92.9) indicates that the immediate upside is likely exhausted, suggesting a pause before further gains.
* Trend constraint: The stock is capped by the SMA50 (518.51 GBp) and the Bollinger upper band (516.50 GBp), limiting immediate breakout potential.
* Verdict invalidated: The hold stance is invalidated if the price clears 520.00 GBp on high volume, signaling a structural trend reversal.
Strategy parameters:
* Entry Range: 485.00 – 490.00 GBp (near SMA20 support).
* Exit Target: 516.00 – 518.00 GBp (testing current resistance).
* Stop Loss: 475.00 GBp (to protect against a breakdown of the short-term recovery trend).
For the average investor, this suggests that while the recent rally is genuine, it is currently running into a wall of sellers and is likely to tread water until momentum indicators reset.
*Disclaimer: This analysis is for educational purposes only and does not constitute financial advice. Data sourced from market exchanges. Transactions in financial markets carry inherent risks.*
Summary Data BP
| Last price | 507.70 GBp |
| Change 1 day / 5 days / 1 month | 0.53% / 6.99% / -1.11% |
| Trend / MA-cross | sideways / none |
| SMA20 / SMA50 | 483.72 / 518.51 |
| RSI (14) / Stochastic %K | 58.5 / 92.9 |
| Bollinger %B / ATR | 87% / 11.88 |
| Support / Resistance 20 days | 455.60 / 516.50 |
| Data as of | 14 Juli 2026 14:00 WIB |



