OCBC Stock Technicals Today: Gains 3.20%, RSI Overbought
Technical analysis of OCBC stock on Juli 16, 2026: price 28.36 SGD, trend uptrend, RSI 83.2, support 24.62, resistance 27.88. Key angle: OCBC Stock Technicals.

OCBC Bank (O39.SI) shares surged on the Singapore Exchange (SGX) as of July 14, 2026, closing at 28.36 SGD, marking a significant daily gain of 3.20%. This rally underscores a sharp acceleration in momentum, with the stock posting a 16.90% climb over the past month. Investors are currently navigating a market environment where aggressive buying interest is pushing the bank’s valuation into technically stretched territory, as evidenced by the stock’s position relative to its historical volatility bands.
Trend and Price Action
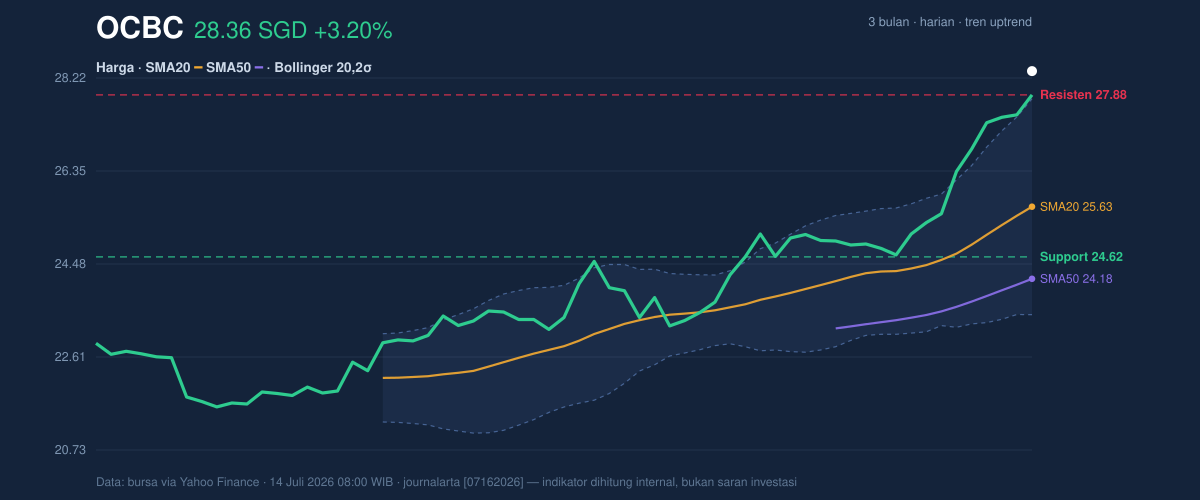
The prevailing trend remains firmly bullish. With the price at 28.36 SGD, OCBC is trading comfortably above both its SMA20 of 25.63 and SMA50 of 24.18. The 5-day slope of the SMA20 at 3.82% highlights a rapid vertical shift in the bank's moving average, signaling that the current ascent is not merely a drift but a coordinated institutional push. Having cleared the recent 3-month high of 27.92, the stock has entered a discovery phase. However, the price currently rests at 113% of the Bollinger Band width, placing it well outside the upper band threshold of 27.80. When a stock consistently hugs or exceeds the upper Bollinger boundary, it often warns that the pace of appreciation is becoming unsustainable in the short term.
Oscillators and Momentum
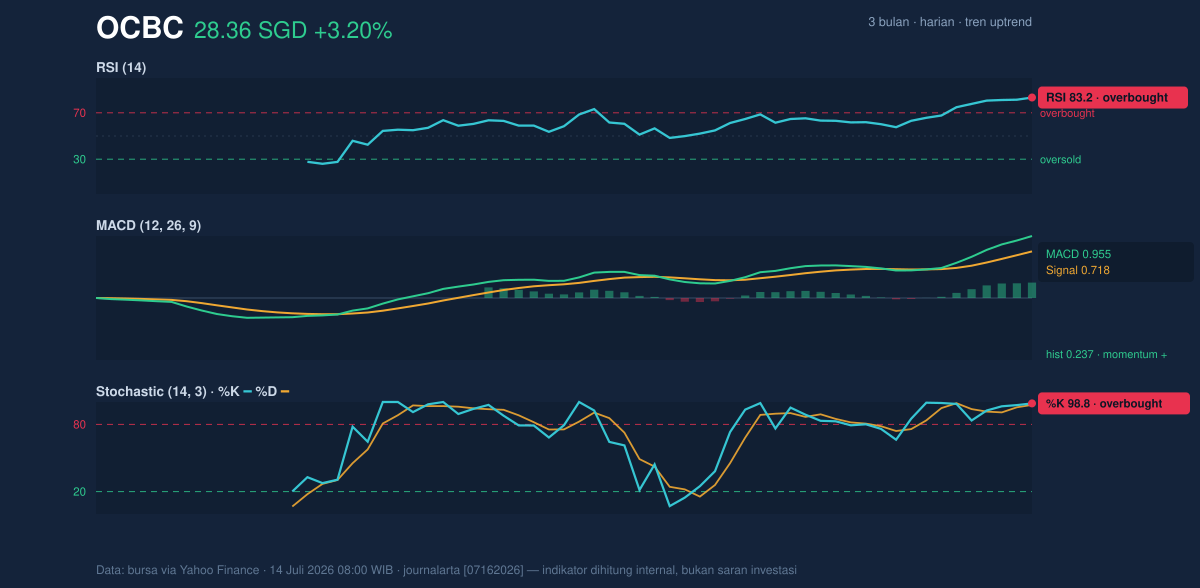
The internal momentum indicators provide a stark warning that the current rally may be overheating. The RSI sits at 83.2, firmly in overbought territory (>70), suggesting that the buying frenzy has reached a point where a consolidation or cooling-off period is statistically probable. Complementing this, the Stochastic %K at 98.8 and %D at 97.4 are locked in an extreme overbought state, indicating that the immediate upside potential may be limited by a lack of fresh liquidity at these elevated levels. Nevertheless, the MACD remains in positive momentum territory with a reading of 0.955 above the signal line of 0.718 and a positive histogram of 0.237, suggesting that while the indicators are stretched, the primary trend has not yet bucked.
Volatility and Volume
Participation confirms the trend’s legitimacy. With a volume of 6,416,000 shares—roughly 1.1x the 20-day average—the move is supported by active market volume rather than thin, speculative trades. The On-Balance Volume (OBV) continues to trend upward, reflecting a persistent flow of capital into the stock. Despite the high velocity, the ATR of 0.45 (approximately 1.6% of the current price) indicates that volatility remains within a manageable range for a large-cap financial institution, preventing the stock from becoming purely erratic.
Key Levels and Scenarios
The immediate hurdle is the 20-day resistance of 27.88, which the stock has effectively pierced. Should the price fail to hold above this level, the primary support rests at the SMA20 of 25.63, which now serves as the dynamic floor for the trend. A breakdown below 24.62 (20-day support) would be required to suggest that the current bullish momentum has fundamentally fractured.
Technical Verdict: HOLD (wait & see)
* Reasoning: The current price is significantly extended beyond the upper Bollinger Band, and both RSI and Stochastic are flashing extreme overbought signals, suggesting a high probability of a mean-reversion pull-back.
* Verdict invalidated: The outlook for further consolidation is invalidated if the price successfully establishes a new support floor above 28.00 for three consecutive sessions, indicating absorption of existing sell-side pressure.
* Entry Range: 25.60 – 26.00 SGD (post-pullback consolidation)
* Exit Target: 28.50 – 29.00 SGD (momentum extension)
* Stop Loss: 24.50 SGD (protection below 20-day support)
For those who do not actively trade, the current price activity suggests that the bank is seeing high demand, but the rapid speed of the recent climb makes the stock prone to a temporary price correction as traders take profits.
*
Data Summary (per 14 July 2026)**
* Last Price: 28.36 SGD
* SMA20/50: 25.63 / 24.18
* RSI(14): 83.2 (Overbought)
* Bollinger Upper: 27.80
* Volume: 6,416,000 (1.1x average)
Summary Data OCBC
| Last price | 28.36 SGD |
| Change 1 day / 5 days / 1 month | 3.20% / 7.67% / 16.90% |
| Trend / MA-cross | uptrend / none |
| SMA20 / SMA50 | 25.63 / 24.18 |
| RSI (14) / Stochastic %K | 83.2 / 98.8 |
| Bollinger %B / ATR | 113% / 0.45 |
| Support / Resistance 20 days | 24.62 / 27.88 |
| Data as of | 14 Juli 2026 08:00 WIB |



