Shell Testing Key Resistance: Stock Gains 0.66% (Juli 16, 2026)
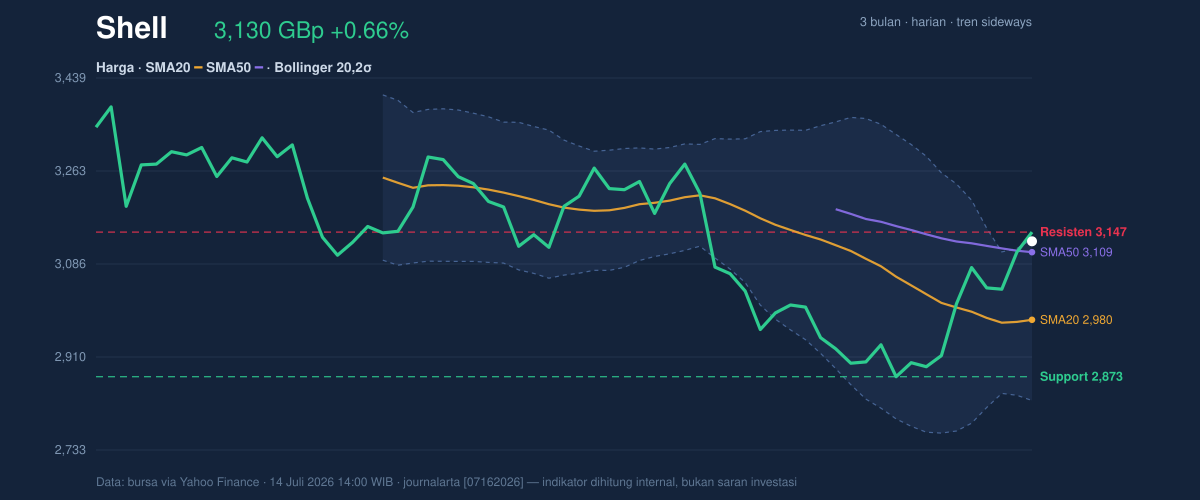
On Juli 16, 2026: price 3,129.50 GBp, trend sideways, RSI 59.8, support 2,872.50, resistance 3,147.00. technical analysis of shell stock.

Shell plc shares climbed to 3,129.50 GBp on the London Stock Exchange, marking a modest 0.66% gain that underscores the company’s resilient positioning within the FTSE 100. This uptick reflects a broader consolidation phase, as investors digest energy market signals against a backdrop of tightening supply expectations. While the broader energy sector navigates shifting policy mandates, Shell’s current price action remains tethered to its mid-range technical structure, balancing long-term stability against short-term speculative pressure.
Trend & Price Action
The stock currently occupies a curious position: trading at 3,129.50 GBp, it sits comfortably above its SMA20 of 2,980.43 and just marginally ahead of the SMA50 of 3,108.73. This placement confirms that while the primary trend has been sideways—evidenced by the slight -0.78% slope of the 20-day moving average—the asset has successfully reclaimed its medium-term momentum base. The price is currently testing the upper threshold of the Bollinger band at 3,133.61, an area that historically invites profit-taking as the stock reaches the outer limits of its recent volatility range.
Oscillators & Momentum
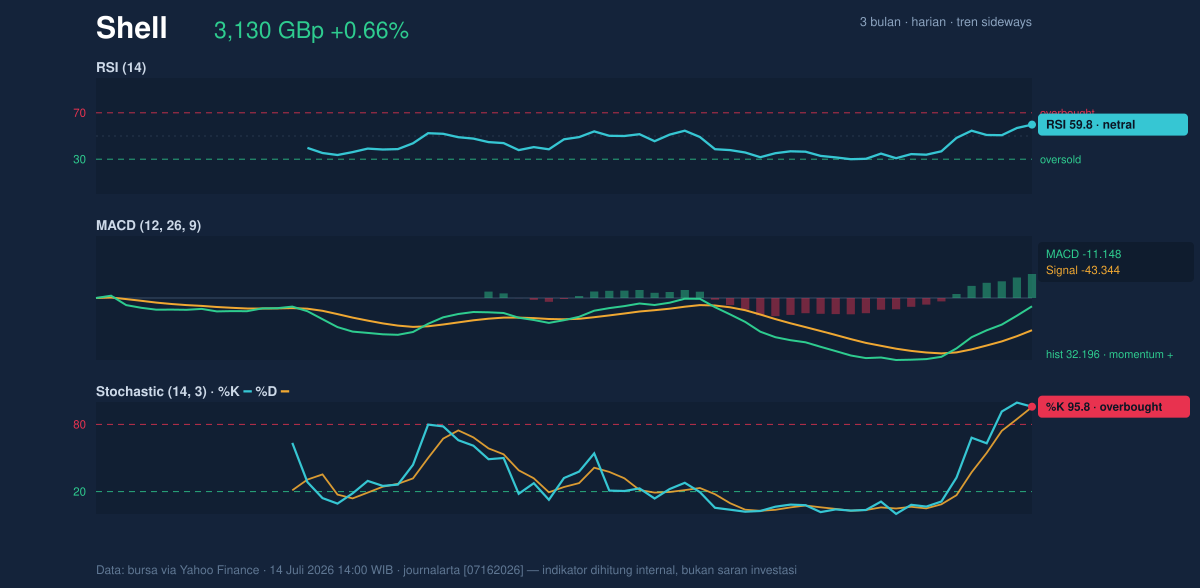
The internal mechanics of the stock suggest a conflict between price strength and immediate exhaustion. The RSI sits at 59.8, a neutral zone that signals neither over-extension nor lack of interest, yet the Stochastic oscillator at 95.8/95.6 paints a more aggressive picture of overbought conditions. This divergence implies that while the underlying trend remains supported by a positive MACD histogram of 32.196, the pace of the recent 3.94% five-day rally may be pushing the stock into a vulnerable state. Investors should note that the MACD line of -11.148 is steadily narrowing the gap toward the signal line, suggesting a potential shift in momentum intensity.
Volatility & Volume
The most striking feature of the current session is the volume profile. Trading volume surged to 17,306,298 shares, representing a 1.7x jump over the 20-day average of 10,243,414. Such a pronounced increase in participation, coupled with a rising On-Balance Volume (OBV) indicator, suggests that institutional buyers are aggressively confirming the current price levels. With an ATR of 127.49, Shell is currently experiencing high volatility, equivalent to 4.1% of its share price. This level of turbulence suggests that traders should expect significant intraday swings, especially as the stock approaches the major resistance level of 3,147.00 GBp.
Technical Verdict: HOLD
The technical outlook for Shell is currently a HOLD, driven by the following factors:
* The Stochastic indicator in overbought territory (95.8) signals that a temporary pullback or consolidation is likely before further gains can be sustained.
* The proximity to the Bollinger upper band (3,133.61) and the 20-day resistance (3,147.00) suggests limited immediate upside relative to the high volatility (ATR 127.49).
* Verdict invalidated if price breaks above 3,147.00 GBp with sustained volume, which would signal a breakout from the current sideways channel.
Ideal technical parameters:
* Entry Range: 2,980 – 3,010 GBp (reversion toward SMA levels)
* Exit Target: 3,147 GBp (near-term resistance)
* Stop Loss: 2,872.50 GBp (key support)
The current market enthusiasm reflects a strong appetite for liquidity, yet the technical signals advise waiting for a cooling-off period before seeking new entry opportunities.
Summary Data Shell
| Last price | 3,129.50 GBp |
| Change 1 day / 5 days / 1 month | 0.66% / 3.94% / 2.00% |
| Trend / MA-cross | sideways / none |
| SMA20 / SMA50 | 2,980.43 / 3,108.73 |
| RSI (14) / Stochastic %K | 59.8 / 95.8 |
| Bollinger %B / ATR | 99% / 127.49 |
| Support / Resistance 20 days | 2,872.50 / 3,147.00 |
| Data as of | 14 Juli 2026 14:00 WIB |



