OCBC Stock Gains 3.23% Today, RSI Overbought
On Juli 17, 2026: price 28.78 SGD, trend uptrend, RSI 85.2, support 24.63, resistance 28.36. technical analysis of ocbc stock. Key angle: OCBC Stock Gains.

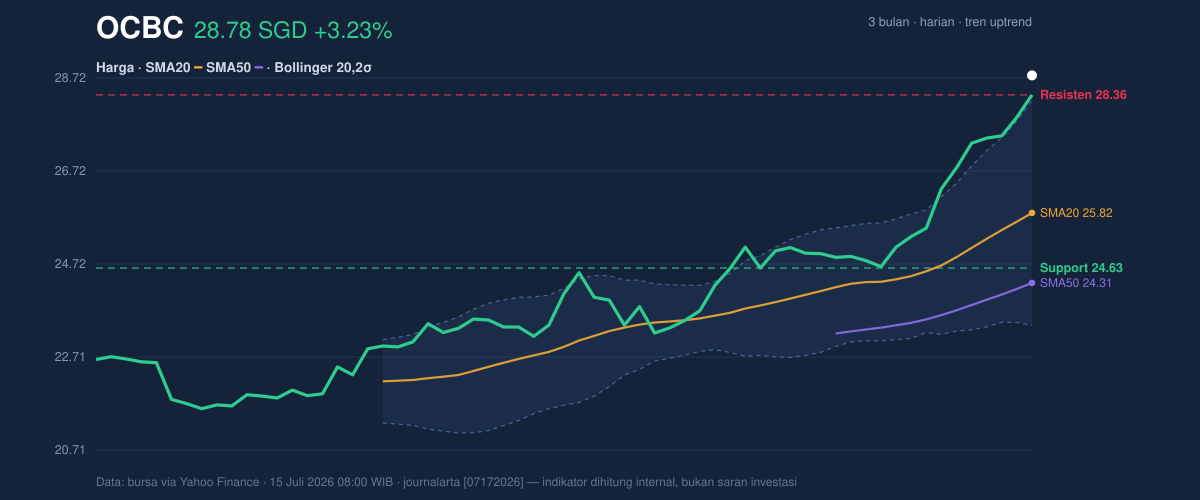
OCBC Bank (O39.SI) shares surged to a last price of 28.78 SGD in early trading, reflecting a sharp 3.23% daily gain as investors react to renewed sector momentum. Data from the Singapore Exchange indicates the stock has climbed 16.90% over the past month, effectively decoupling from its prior range-bound performance to challenge historical highs. This aggressive move has pushed the stock well beyond the upper boundary of its Bollinger Band, signaling that the current ascent is driven by high-intensity buying pressure that deviates significantly from the standard statistical distribution of price movement.
Trend and Price Structure
The structural integrity of the OCBC uptrend is evidenced by the positioning of the stock relative to its moving averages. With a SMA20 at 25.82 and a SMA50 at 24.31, the stock remains in a classic bullish alignment, supported by a steep SMA20 slope of 3.83% over 5 days. The price action has decisively cleared the 20-day resistance of 28.36 SGD, marking a breakout into uncharted territory within the recent three-month cycle. By trading at 111% of the Bollinger Band range, the stock is technically overextended; however, the lack of a bearish MA-cross suggests that the structural trend remains robust despite the parabolic climb.
Oscillators and Momentum
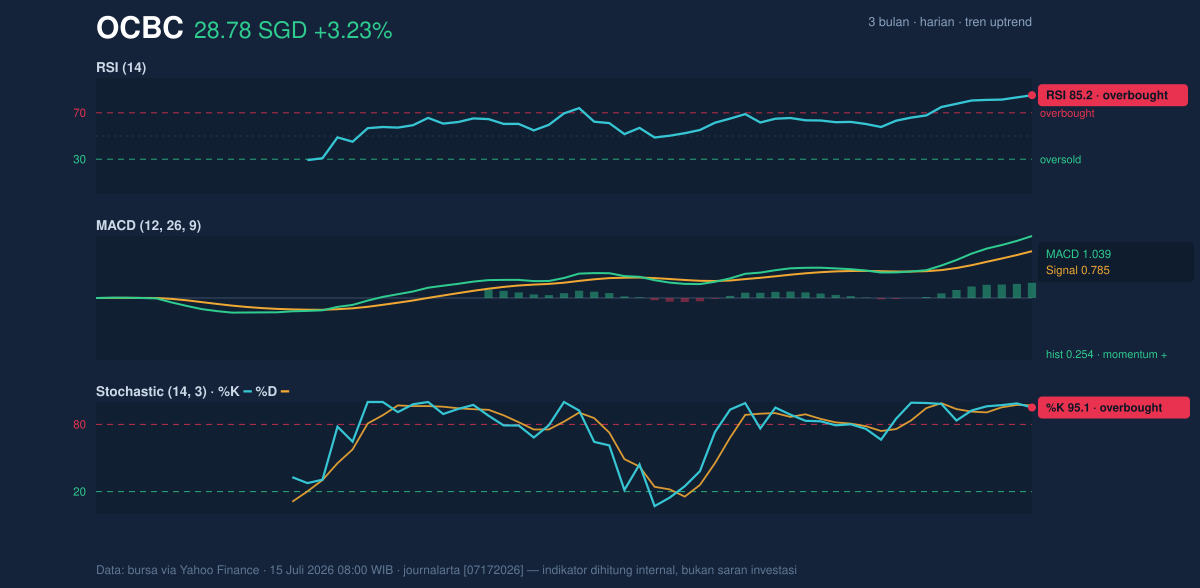
Current momentum readings reflect an environment of extreme buyer urgency, which often serves as a double-edged sword for traders. The RSI(14) at 85.2 is firmly in overbought territory, a level typically associated with a potential cooling-off period rather than sustained vertical growth. This is corroborated by the Stochastic %K at 95.1 and %D at 97.1, both of which signal that the immediate buying capacity may be reaching a point of exhaustion. Conversely, the MACD at 1.039 remains comfortably above its signal line with a positive histogram of 0.254, confirming that the underlying medium-term momentum remains firmly in the bulls' favor despite the overstretched short-term oscillators.
Volatility and Volume
Market participation has intensified alongside the price appreciation. With a volume of 7,356,400 shares, OCBC is trading at 1.3 times the 20-day average, indicating that the breakout is supported by significant institutional interest rather than a liquidity vacuum. The On-Balance Volume (OBV) trend is consistently climbing, acting as a secondary confirmation that capital is actively flowing into the stock. While the ATR(14) of 0.48 suggests the stock is experiencing moderate volatility, the Bollinger Band width of 18.8% remains within a normal range, suggesting that the current move is an expansion of the trend rather than an erratic, unsustainable blow-off top.
Technical Verdict: HOLD (wait & see)
The current technical configuration for OCBC is a study in conflicting signals: strong trend momentum against extreme overbought conditions. The status of the RSI at 85.2 and Stochastic at 95.1 suggests a high probability of a mean-reversion move, even if the structural trend remains bullish.
* Entry Range: 25.80 – 26.50 SGD (Seeking a retracement toward the SMA20)
* Exit Target: 29.50 SGD (Projecting potential extension of current trend)
* Stop Loss: 24.60 SGD (Below the 20-day support level)
This verdict is invalidated if the stock sustains a close above the 29.00 SGD level for two consecutive sessions, which would neutralize the current overbought warnings and signal a new phase of momentum. Investors are currently watching for a consolidation phase, as the extreme readings on momentum indicators imply that the recent rapid gains may require a period of price stabilization before further growth can be fundamentally justified.
OCBC Bank's next significant movement will likely be influenced by broader index flows following the upcoming release of mid-quarter banking sector updates.
Summary Data OCBC
| Last price | 28.78 SGD |
| Change 1 day / 5 days / 1 month | 3.23% / 7.43% / 16.90% |
| Trend / MA-cross | uptrend / none |
| SMA20 / SMA50 | 25.82 / 24.31 |
| RSI (14) / Stochastic %K | 85.2 / 95.1 |
| Bollinger %B / ATR | 111% / 0.48 |
| Support / Resistance 20 days | 24.63 / 28.36 |
| Data as of | 15 Juli 2026 08:00 WIB |



