DBS Stock Drops 0.72%, RSI Overbought In Focus
On Juli 20, 2026: price 71.96 SGD, trend uptrend, RSI 75.7, support 65.40, resistance 72.98. technical analysis of dbs stock. DBS Stock Drops — full details…

DBS Group shares slipped 0.72% to S$71.96 in the latest session — a small decline that matters less for its size than for its address. According to SGX data via Yahoo Finance as of 17 July 2026, the pullback occurred directly beneath S$72.98, the bank's 20-day resistance, after a 9.10% rally over the past month. The question hanging over Singapore's largest lender is whether this is a healthy pause at the ceiling or the first sign of exhaustion.
Trend & Price Action
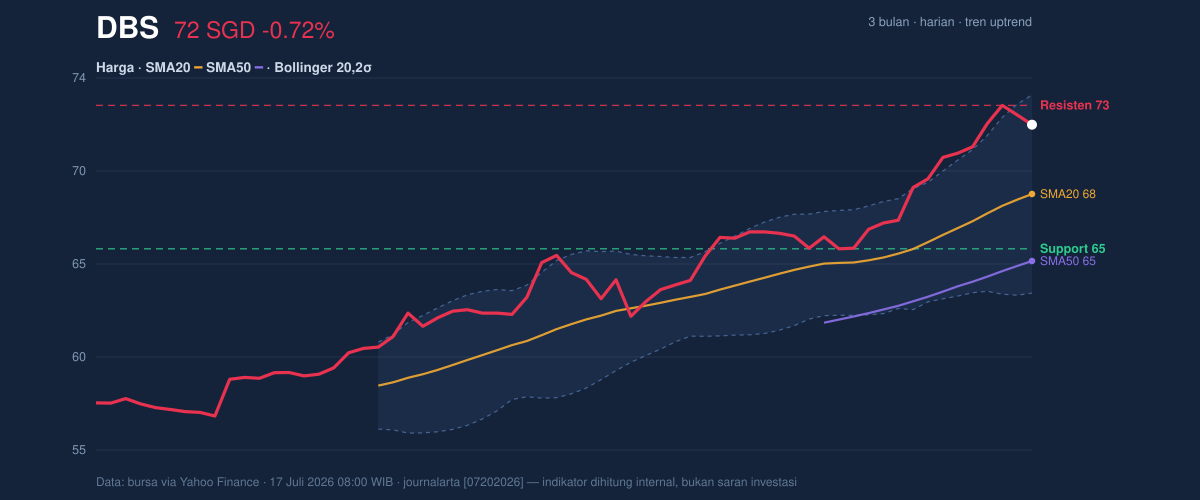
The trend itself is not in dispute. DBS trades above its 20-day moving average of S$68.30 and its 50-day average of S$64.75 — a bullish stack that has persisted without any fresh moving-average crossover. More telling is the slope: the SMA20 is rising at 2.71% every five sessions, an unusually steep gradient for a large-cap bank. That signals a trend that is accelerating, not flattening.
The location, however, is stretched. The price now sits at 87% of its 20-day range between support at S$65.40 and resistance at S$72.98, and within touching distance of the three-month high of S$73.55 — a long climb from the S$56.56 low. Thursday's dip, after a 2.14% five-day gain, reads as a first rejection at that ceiling.
The trend is strong. The entry point is not.
Oscillators & Momentum
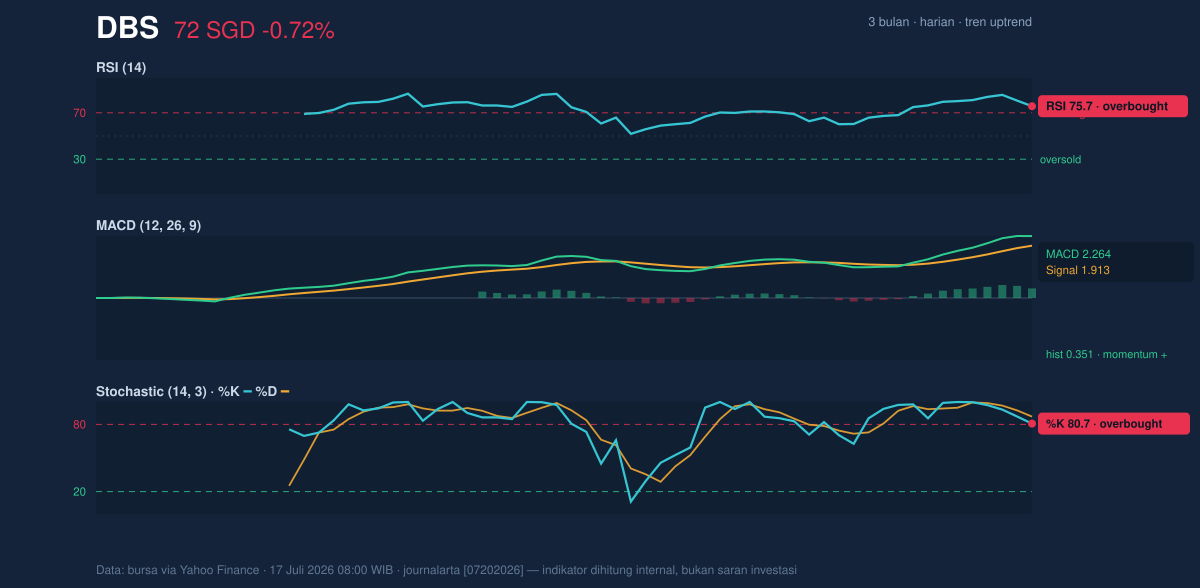
As shown in the momentum chart, the short-term gauges are flashing heat. The RSI at 75.7 is firmly overbought — above the 70 threshold that typically marks one-sided buying vulnerable to a cooldown. The Stochastic adds a sharper warning: %K at 80.7 has crossed below %D at 87.0 while both sit above 80, a classic early signal that short-term momentum is rolling over *inside* overbought territory.
Yet the medium-term engine disagrees. The MACD at 2.264 holds above its signal line at 1.913, with a positive histogram of 0.351 — trend power is still expanding, not contracting. This is a genuine timeframe conflict: the sprint is overheated, but the marathon runner underneath is still strong.
The dashboard says amber, not red.
Volatility & Volume
Volatility data softens the bearish case. The Bollinger %B at 85% shows price pressing the upper band at S$73.53, but band width of 15.3% is normal — no squeeze, no explosive expansion. Meanwhile the ATR of 1.08, just 1.5% of price, is low. This pattern describes orderly, institutional-style accumulation rather than speculative froth; pullbacks from such readings tend to be corrective, not disorderly.
Volume confirms the nuance. The latest 3.95 million shares are roughly 1.0× the 20-day average — no surge of breakout energy at the highs, which explains why resistance held. But On-Balance Volume is still rising, meaning cumulative money flow has not flipped to distribution. Sellers have not seized the tape.
Key Levels & Scenarios
The ceiling is well defined: S$72.98 resistance, then S$73.55 — a level reinforced by the upper Bollinger band at S$73.53. That near-perfect confluence makes 73.53–73.55 a formidable barrier. On the downside, S$68.30 is doubly protected as both the SMA20 and the Bollinger mid-line, with S$65.40 as the structural 20-day support below it.
The scenarios write themselves. A close above S$73.55 on rising volume resets the range higher and reactivates momentum continuation. A loss of S$68.30 would confirm the overbought signals and likely extend the pullback toward S$65.40. Between those lines, expect digestion — the market working off its heat through time rather than price.
Technical Verdict: HOLD
HOLD (wait & see) — the trend argues against exiting, but the oscillators argue against chasing.
- Trend structure bullish: price above a steeply rising SMA20/SMA50, with MACD histogram positive at 0.351 — the uptrend's engine is intact.
- Momentum overbought at resistance: RSI 75.7 and a Stochastic bearish cross above 80, with price at 87% of its range, tilt the short-term risk-reward against new entries at S$72+.
- No breakout confirmation: volume at 1.0× average shows no fresh buying surge to power through S$73.55.
*Verdict invalidated if the price falls below S$68.30 (SMA20/mid-Bollinger) — that would flip the bias defensive; conversely, a close above S$73.55 upgrades the picture to momentum continuation.*
- Entry Range: S$68.30 – S$65.40 (a pullback into the SMA20-to-support zone)
- Exit Target: S$72.98, with S$73.55 as the stretch objective
- Stop Loss: below S$63.06 (the lower Bollinger band, where the bullish structure breaks)
This is technical analysis, not an investment recommendation; the site disclaimer applies. In plain English: DBS's uptrend is real, but right now the shares are priced at the top of their own recent history — the patient play is to let the price come to you.
Summary Data DBS
| Last price | 71.96 SGD |
| Change 1 day / 5 days / 1 month | -0.72% / 2.14% / 9.10% |
| Trend / MA-cross | uptrend / none |
| SMA20 / SMA50 | 68.30 / 64.75 |
| RSI (14) / Stochastic %K | 75.7 / 80.7 |
| Bollinger %B / ATR | 85% / 1.08 |
| Support / Resistance 20 days | 65.40 / 72.98 |
| Data as of | 17 Juli 2026 08:00 WIB |


