Testing Key Resistance, HSBC Stock Drops 0.11% Today
On Juli 20, 2026: price 1,492.20 GBp, trend uptrend, RSI 64.6, support 1,422.60, resistance 1,493.80. technical analysis of hsbc stock.

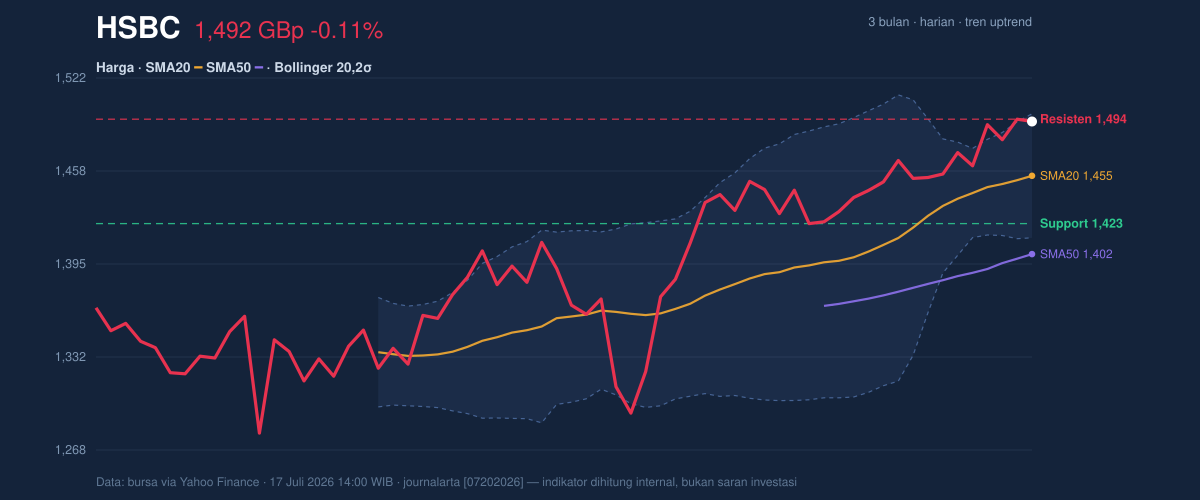
HSBC Holdings shares closed the latest session at 1,492.20 pence on the London Stock Exchange — less than two pence below their 20-day resistance of 1,493.80, according to exchange data via Yahoo Finance as of 17 July 2026. The stock has gained 4.23% over the past month and is now pressing against the ceiling of its recent range with its volatility bands at their tightest in weeks. That combination — price at the top of the range, energy coiled — is what makes this a decision moment for the chart.
Trend & Price Action
The trend is unambiguously upward. The share price sits above its 20-day simple moving average of 1,455.20 — the average closing price of the past month — and comfortably above the 50-day average at 1,401.81. More telling is the slope: the 20-day average itself is climbing at 1.09% every five sessions, meaning the rising trend is pulling prices higher even on quiet days. There is no new moving-average crossover, which simply confirms this is an established uptrend rather than a fresh one.
Positioning adds nuance. At 1,492.20, the stock trades at 98% of its 20-day range — buyers have driven it to the very top of recent territory. Yet it remains roughly 6% below its three-month high of 1,590.00, so this is a recovery pushing into a test, not a record run. As shown in the chart below, price has ridden the upper half of its band structure for most of the past month.
Momentum & Oscillators
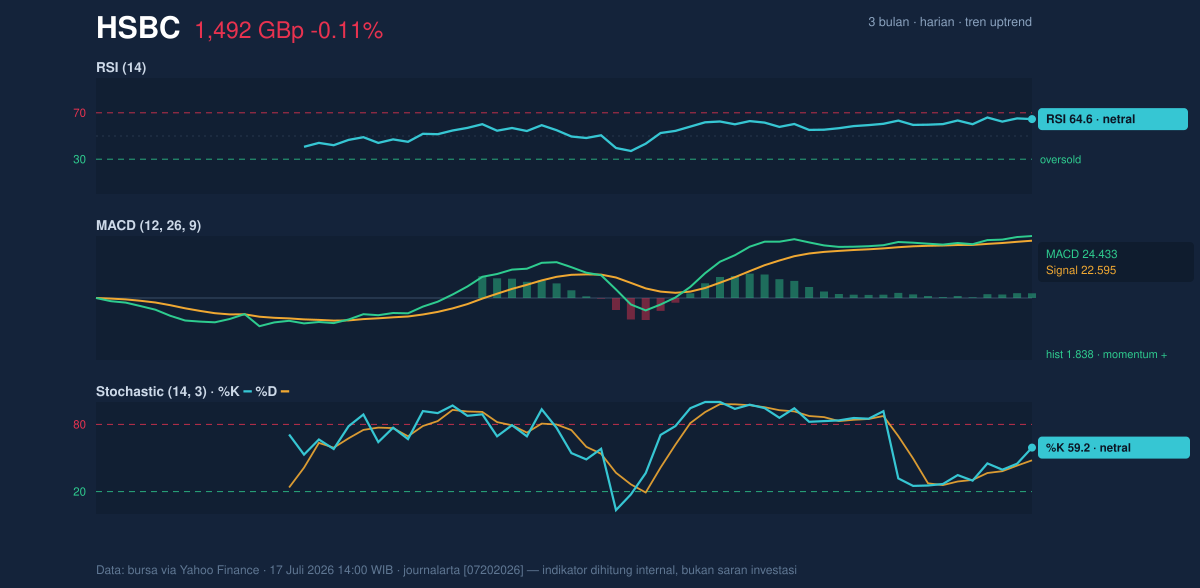
Momentum indicators — tools that measure the speed of price moves rather than their direction — are aligned with the uptrend, with no warning divergences. The RSI at 64.6 (Relative Strength Index, a 0–100 gauge where 70 marks overbought) shows buyers in control without the market being stretched. The Stochastic has crossed bullishly, with %K at 59.2 rising above %D at 47.9 — a short-term signal that upward momentum is re-accelerating after a pause.
The MACD, which tracks the gap between two moving averages to detect momentum shifts, reinforces this: the MACD line at 24.433 sits above its signal line at 22.595, with a positive histogram of 1.838. Momentum is positive and widening, not fading. All three oscillators, visible in the chart below, point the same way — up, but not overheated.
Volatility & Volume
This is where the story gets interesting. The Bollinger Bands have narrowed to a width of just 5.8% — a "squeeze." Bollinger Bands plot two standard deviations around the 20-day average, and when they pinch together this tightly, history shows a sharp expansion — a breakout move — usually follows. With the %B reading at 94%, price is already hugging the upper band at 1,497.46, leaning on the ceiling rather than the floor.
But one ingredient is missing: participation. The latest volume of 17.7 million shares is 0.9 times the 20-day average of 19.1 million — the push into resistance is happening on below-average turnover. Countering that, the On-Balance Volume (OBV) is rising, a cumulative measure suggesting quiet accumulation underneath. Average daily swings of 43.45 pence (ATR, 2.9% of price) indicate moderate volatility — enough to cover the gap from here to the 20-day average in a single session.
Key Levels & Scenarios
The levels are cleanly drawn. Overhead, the barrier is the 1,493.80–1,497.46 zone: the 20-day resistance fused with the upper Bollinger Band. A decisive close above that zone, backed by rising volume, would clear the path toward the three-month high of 1,590.00. Below, the first cushion is the SMA20 at 1,455.20, then the 20-day support at 1,422.60, with the lower band at 1,412.94 as the last line of the current structure.
The squeeze means this stalemate will not last. Direction is the open question — and the evidence, while leaning upward, has not yet confirmed it.
Technical Verdict: HOLD (wait & see)
The technical verdict is HOLD (wait & see), for three reasons:
- Trend and momentum agree: price above a rising SMA20/50, with MACD positive and a fresh bullish Stochastic cross.
- But price is at resistance, not above it: %B at 94% means the stock is stretched against the upper band — entering here means buying the ceiling.
- Volume does not confirm a breakout yet: 0.9× average turnover means the push lacks crowd conviction.
Verdict invalidated if the price falls below 1,422.60, breaking the 20-day support and the rising structure.
- Entry Range: 1,494–1,498, only on a confirmed close above the 1,493.80 resistance and 1,497.46 upper band with rising volume; alternatively on a pullback toward 1,455 (SMA20).
- Exit Target: 1,590.00, the three-month high.
- Stop Loss: a close below 1,422.60, the 20-day support.
In plain English: the shares are knocking on a ceiling with the wind at their back — the chart says wait for the door to actually open, or for the floor to give way, before drawing conclusions. This is technical analysis, not an investment recommendation.
| Indicator | Level |
|---|---|
| Last price | 1,492.20 GBp |
| SMA20 / SMA50 | 1,455.20 / 1,401.81 |
| Bollinger upper / lower | 1,497.46 / 1,412.94 |
| RSI (14) | 64.6 |
| MACD / Signal | 24.433 / 22.595 |
| Resistance / Support (20d) | 1,493.80 / 1,422.60 |
| 3-month High / Low | 1,590.00 / 1,256.20 |
Summary Data HSBC
| Last price | 1,492.20 GBp |
| Change 1 day / 5 days / 1 month | -0.11% / 1.44% / 4.23% |
| Trend / MA-cross | uptrend / none |
| SMA20 / SMA50 | 1,455.20 / 1,401.81 |
| RSI (14) / Stochastic %K | 64.6 / 59.2 |
| Bollinger %B / ATR | 94% / 43.45 |
| Support / Resistance 20 days | 1,422.60 / 1,493.80 |
| Data as of | 17 Juli 2026 14:00 WIB |



