AIA Testing Key Resistance: Stock Gains 1.85% (Juli 22, 2026)
On Juli 22, 2026: price 76.95 HKD, trend sideways, RSI 53.4, support 70.80, resistance 76.20. technical analysis of aia stock. AIA Testing Key Resistance —…

AIA Group closed at HKD 76.95, up 1.85% on the day and extending its 5-day gain to 6.28%, but the move now puts the stock just above a near-term ceiling that the chart has been respecting. The shares are trading above SMA20 at 73.44 and below SMA50 at 78.02, a setup that usually signals an intermediate market still searching for direction rather than a clean breakout trend.
Trend & Price Action
The broader pattern remains sideways, and that matters because it tells investors the recent rise is happening inside a range, not yet in a confirmed uptrend. The SMA20 slope of 0.18% over 5 days is gently positive, which suggests short-term improving momentum, but the absence of a new MA-cross means the moving averages have not delivered the kind of trend confirmation that often accompanies a sustained breakout.
As shown in the chart, the price is pressing against the upper end of its recent band. The 20-hour resistance at 76.20 has effectively been challenged, and the stock’s last print at 76.95 places it above that marker. That tells us the market is testing whether this is a genuine expansion move or simply a brief overshoot. The stock is also trading near the top of its 3-month range, with the recent high at 89.95 and low at 69.05, so there is room above, but not much technical proof yet that buyers have taken control.
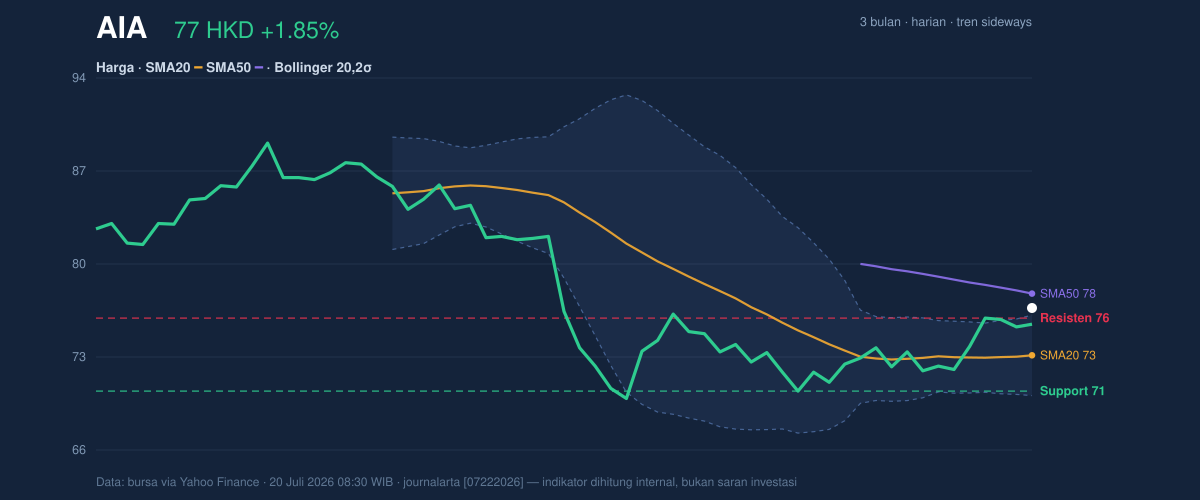
The Bollinger structure adds an important nuance. The upper band sits at 76.42, and the price at 76.95 is already above it, with %B at 109%. In plain terms, that means the stock is trading beyond the statistical envelope of its recent average price action. That can happen in strong moves, but it also often signals that the market is stretched in the short term and may need either consolidation or a stronger volume-backed push to keep rising.
Oscillators & Momentum
The momentum picture is constructive, but not yet emphatic. RSI at 53.4 is neutral, which means the stock is neither overbought nor oversold. That is useful because it leaves room for further upside if buyers keep stepping in, but it also shows the rally has not become overheated. The Stochastic %K at 78.0 and %D at 79.5 sit near the upper end of their range, which often indicates a market that is close to overbought territory without fully tipping into it. In practical terms, that reflects short-term strength, but also a rising risk of pause if momentum fails to accelerate.
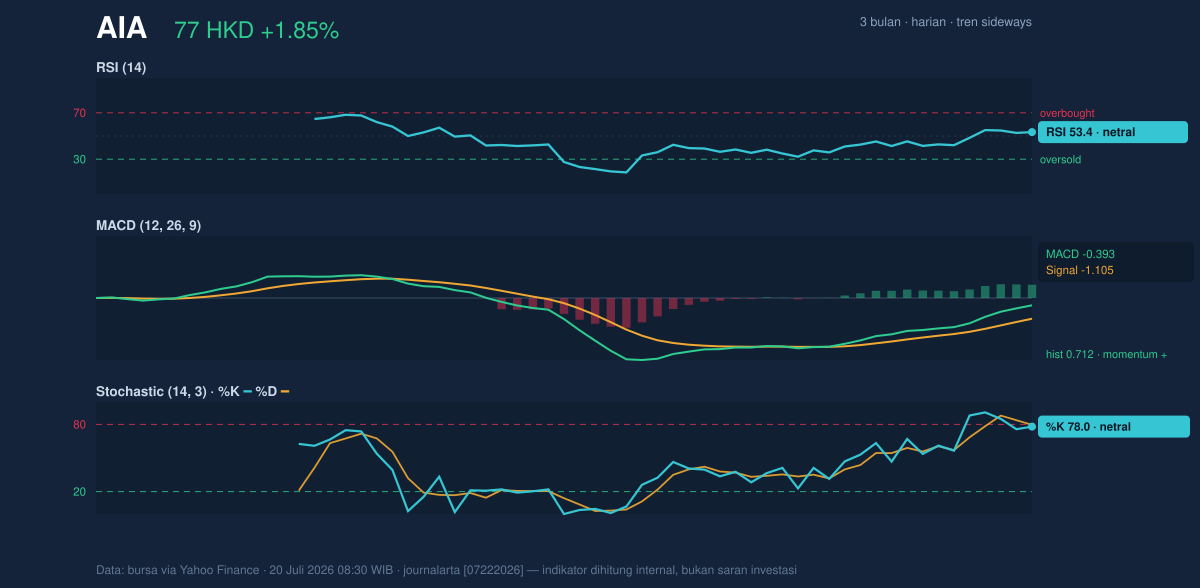
The most encouraging signal is in the MACD. The MACD at -0.393 remains below zero, but the signal line at -1.105 is lower still, leaving a positive histogram of 0.712. That combination means downside momentum has weakened and the short-term trend is improving from a subdued base. It is not a full bullish reversal on its own, but it does show that the stock is gaining traction even while the broader trend remains range-bound.
Volatility & Volume
Volatility is moderate rather than explosive. The ATR of 2.01, equal to 2.6% of the share price, suggests the stock can move, but not in a disorderly way. That gives the current breakout test some credibility: if the move were purely noise, one would expect far less follow-through in a name with this level of daily range. Still, the Bollinger band width of 8.1% is described as normal, which argues against a volatility squeeze that might precede an outsized move. Instead, the market looks like it is drifting upward within a controlled range.
Volume is the main caution flag. The latest turnover of 17,151,614 shares is only 0.6x the 20-day average of 27,281,866. That means the advance is not being confirmed by broad participation. Price can move higher on light volume, but such moves are often more fragile. The one supportive counterpoint is that OBV is rising, which suggests accumulation has been building over time even if the latest session did not attract heavy trading. In other words, the tape is improving, but the market has not yet shown the kind of force that usually accompanies a decisive trend break.
Key Levels & Scenarios
The immediate technical map is fairly clear. The first line to watch is 76.20 resistance, which the stock has already moved through intraday. If the price can hold above that level, the next reference point becomes the SMA50 at 78.02, which is also the most obvious overhead test in the chart. On the downside, support at 70.80 remains the key floor for the current structure. That sits above the 3-month low of 69.05, so a break below it would start to erode the recovery pattern that has been forming.
The Bollinger middle band at 73.44 doubles as a useful pivot. If the stock slips back below that level, it would suggest the recent surge above the upper band was not sustained and that momentum is fading back toward the range midpoint. If it stays above that midline, the market keeps its short-term constructive bias intact.
Technical Verdict: HOLD (wait & see)
HOLD (wait & see)
- MACD histogram is positive, showing improving momentum, but the MACD line is still below zero, so the trend is not fully confirmed.
- Price is above SMA20 and the upper Bollinger band, which supports strength, yet volume is only 0.6x normal, limiting conviction.
- RSI is neutral and Stochastic is near the upper end, which keeps upside open but also warns the move may need to cool.
Verdict invalidated if price falls below 70.80.
- Ideal Entry Range: 73.44 to 76.20
- Exit Target: 78.02
- Stop Loss protection: 70.80
For non-traders, this means AIA is improving, but the chart still needs stronger confirmation before the move can be treated as durable.
Summary Data AIA
| Last price | 76.95 HKD |
| Change 1 day / 5 days / 1 month | 1.85% / 6.28% / 4.41% |
| Trend / MA-cross | sideways / none |
| SMA20 / SMA50 | 73.44 / 78.02 |
| RSI (14) / Stochastic %K | 53.4 / 78.0 |
| Bollinger %B / ATR | 109% / 2.01 |
| Support / Resistance 20 days | 70.80 / 76.20 |
| Data as of | 20 Juli 2026 08:30 WIB |


