DBS Stock Technicals Today: Gains 0.14%, RSI Overbought
On Juli 22, 2026: price 72.00 SGD, trend uptrend, RSI 75.4, support 65.40, resistance 72.98. technical analysis of dbs stock. DBS Stock Technicals — full…

DBS Group’s shares were last at 72.00 SGD on SGX, up 0.14% from the previous close, and sitting close to the top of its recent trading band. The stock is still in an uptrend, with price above both the SMA20 at 68.86 and SMA50 at 65.28, but the message from momentum is less straightforward: the rally is intact, yet it is starting to look stretched. That tension matters because the market is no longer just asking whether DBS can rise — it is asking how much more upside can be absorbed before traders begin taking profits.
Trend & Price Action
The chart shows a share price that has moved decisively above its short- and medium-term averages, which is typically the first sign that buyers remain in control. The uptrend is reinforced by the SMA20 slope of 2.36% over 5 days, a sign that the recent advance has not been a one-day spike but a sustained climb. With the stock trading above the SMA20 and SMA50, DBS is positioned in the upper part of its trend channel rather than trying to recover from weakness.
That said, the price is also trading near the upper edge of the recent range. The 20-hour resistance at 72.98 is now just above the last price, while the 20-hour support at 65.40 remains the key floor if sentiment cools. The stock is also sitting around 87% of its range, which means most of the recent move has already been priced in. In plain language, the trend is healthy — but the easy part of the rally may already be behind it.
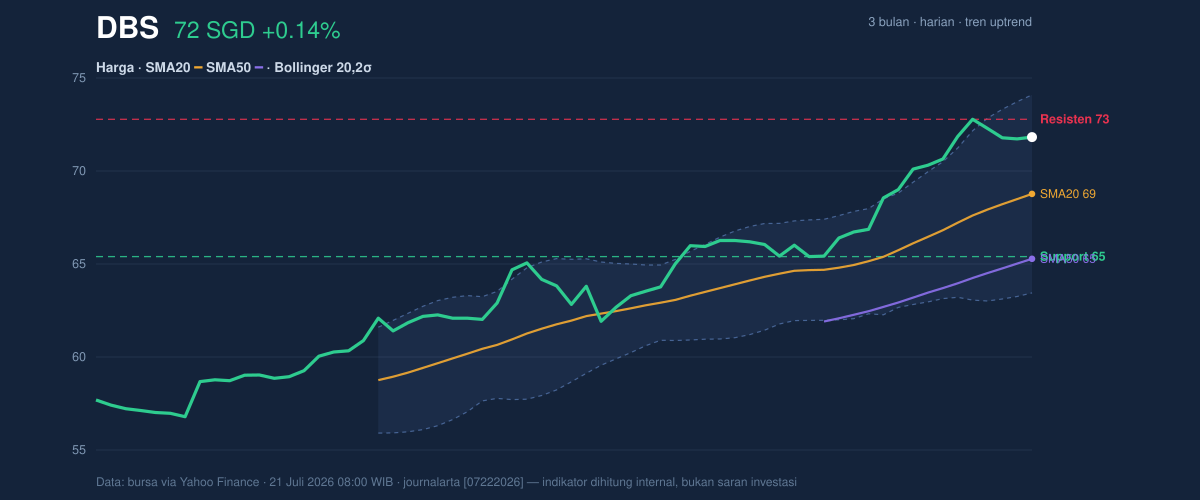
The broader range backs that reading. DBS is trading below its 3-month high of 73.55, but well above its 3-month low of 56.56. That positioning usually signals strength, yet it also leaves less room for traders to chase without demanding fresh confirmation.
Oscillators & Momentum
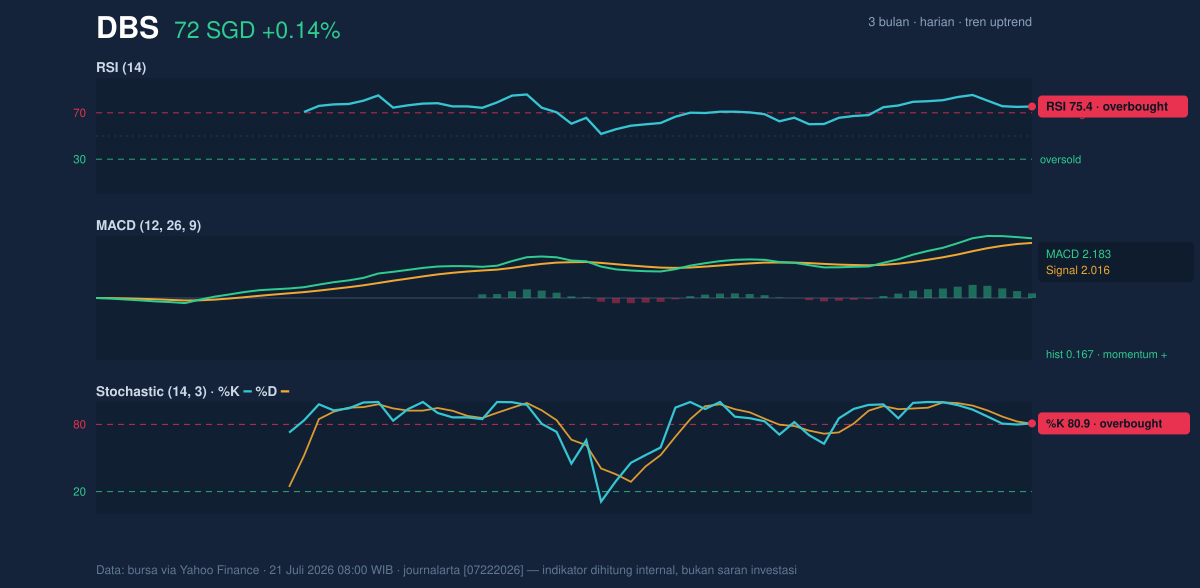
This is where the picture becomes more nuanced. The RSI at 75.4 is in overbought territory, and the Stochastic %K at 80.9 versus %D at 80.5 is also overheated. For general readers, overbought does not mean a stock must fall immediately; it means the pace of buying has become fast enough that the next move is more likely to be pause, consolidation, or a pullback than effortless continuation. In other words, momentum is strong, but it is also crowded.
The good news is that the MACD at 2.183, above its signal line at 2.016, still points to positive momentum. The histogram at 0.167 shows that bullish force remains in place, even if it is not accelerating aggressively. That combination — overbought oscillators with a positive MACD — often describes a stock that is still trending up, but where the market is beginning to debate how much more steam is left.
The signal is not bearish yet. It is simply less forgiving.
Volatility & Volume
Volatility is moderate rather than extreme, with ATR(14) at 1.13, equal to about 1.6% of price. That matters because it suggests DBS is not in a disorderly swing phase; price moves are still contained enough for orderly trading, but large enough that short-term levels can be tested quickly if sentiment shifts. The Bollinger Band width of 15.9% is described as normal, which implies the stock is not in a squeeze that usually precedes a sharp expansion, nor in a panic-like widening that often accompanies stress.
The %B at 79% shows price is near the upper band at 74.33. That is a classic sign of strength, but also a warning that the stock is close to a zone where it has historically become more vulnerable to mean reversion — a move back toward the middle band, which sits at 68.86. Volume adds a useful confirmation: last traded volume of 4,168,300 was roughly 1.0× the 20-hour average of 3,992,493, while OBV is rising. In practical terms, the move is being supported by participation rather than fading on thin turnover.
Key Levels & Scenarios
The immediate battleground is clear: 72.98 resistance versus 65.40 support. If DBS can move through the resistance area with volume staying firm, the chart would be testing the upper part of its 3-month range again, with 73.55 acting as the next visible ceiling. If it fails to hold above the current zone, the first meaningful magnet is the SMA20 at 68.86, which also aligns with the Bollinger middle band. That level is important because it is where a strong trend often pauses to reset without breaking down.
The key point is that the stock is not weak; it is extended. A strong trend can stay extended for some time, but when oscillators are already hot, the market usually wants proof before paying higher prices.
Technical Verdict: HOLD (wait & see)
HOLD (wait & see)
- RSI at 75.4 and Stochastic at 80.9/80.5 show the stock is overbought, so upside may need a pause or consolidation first.
- MACD remains positive and OBV is rising, which supports the trend and argues against a bearish call.
- Price is near 72.98 resistance and close to the Bollinger upper band at 74.33, so the reward-to-risk balance is less attractive for immediate momentum chasing.
- Invalidation condition: this verdict is invalidated if price falls below 65.40.
- Ideal entry range: 68.86 to 65.40
- Exit target: 72.98 to 73.55
- Stop loss protection: below 65.40
For non-traders, that means DBS still looks healthy, but the chart is asking for patience rather than urgency.
“Right now, the stock is still being carried by buyers — but it is close enough to resistance that the next move will tell us whether this is a pause, or the start of a much harder conversation.”
Summary Data DBS
| Last price | 72.00 SGD |
| Change 1 day / 5 days / 1 month | 0.14% / -0.04% / 8.61% |
| Trend / MA-cross | uptrend / none |
| SMA20 / SMA50 | 68.86 / 65.28 |
| RSI (14) / Stochastic %K | 75.4 / 80.9 |
| Bollinger %B / ATR | 79% / 1.13 |
| Support / Resistance 20 days | 65.40 / 72.98 |
| Data as of | 21 Juli 2026 08:00 WIB |


