HSBC Stock Drops 0.25% Today, RSI Overbought
On Juli 22, 2026: price 156.50 HKD, trend uptrend, RSI 71.5, support 147.60, resistance 157.80. technical analysis of hsbc stock. HSBC Stock Drops — full…

HSBC Holdings’ Hong Kong-listed shares ended at HKD 156.50, down 0.25% on the day, but still sitting close to the top of a recent trading band as the stock extends an established uptrend. The move matters less for the small daily dip than for where price is sitting: above both major moving averages, near the upper Bollinger band, and just under a nearby resistance area. That combination says the market is still rewarding the trend, even as short-term momentum looks stretched.
Trend & Price Action
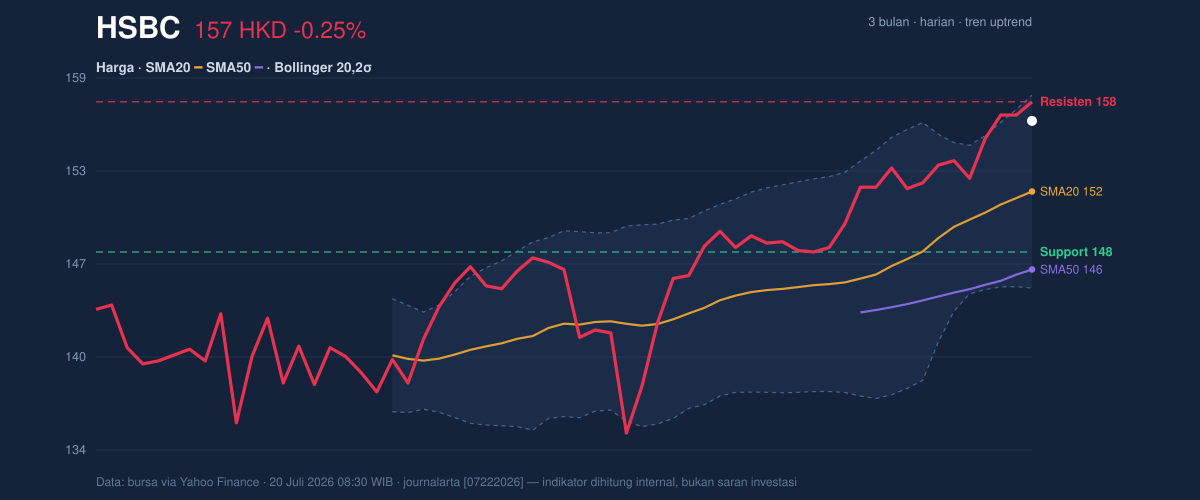
The broader structure remains constructive. The share price is trading above the SMA20 at HKD 151.70 and the SMA50 at HKD 146.41, which tells readers that recent buying has been strong enough to keep the stock above both its short- and medium-term trend lines. The SMA20 is rising by 1.60% over 5 days, a simple sign that the near-term trend is still pointing higher rather than flattening out. There is no fresh MA cross, so this is not a breakout triggered by a new moving-average signal; instead, it is a continuation move, where price has already been trending above support and is now testing the upper end of its range.
The stock is also trading at 87% of its 20-day range, which puts it near the upper boundary rather than in the middle of the band. As shown in the chart, that positioning is important: when a stock spends most of its time near the top of its range, it usually reflects persistent demand, but it also means there is less room for error if sellers begin to appear.
A short pullback would not automatically damage the trend. But a failure to hold the recent support zone would change the tone quickly.
Oscillators & Momentum
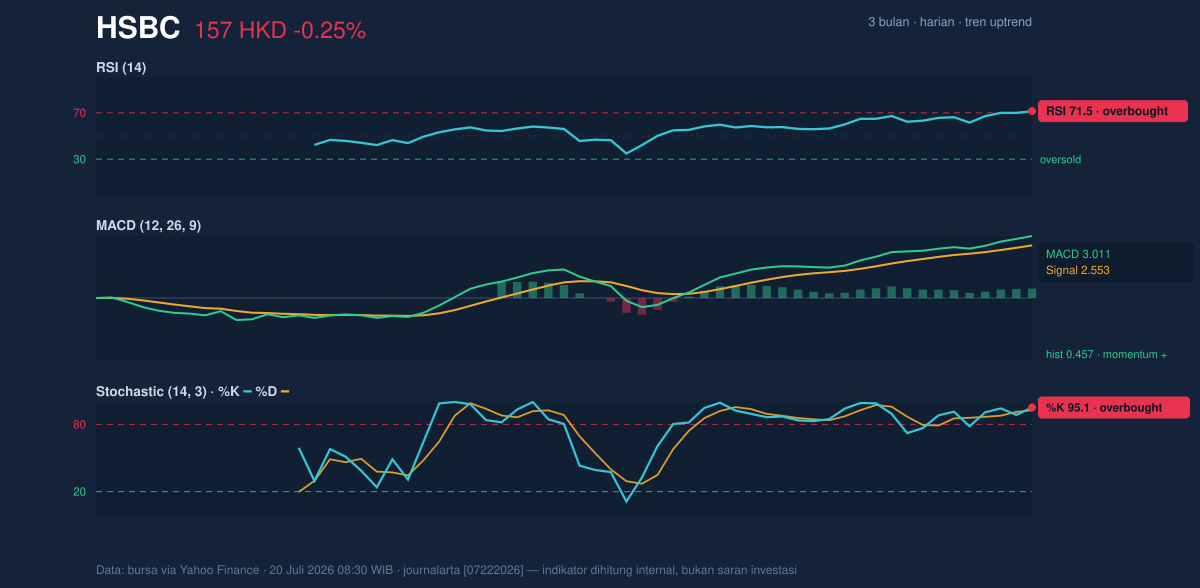
The momentum picture is stronger than the price action alone suggests — but also more extended. The RSI at 71.5 and Stochastic %K at 95.1 / %D at 92.6 both sit in overbought territory, which means the stock has risen fast enough that short-term traders may already be crowded on the same side of the trade. In plain language, “overbought” does not mean the stock must fall; it means the pace of the advance has been strong enough that the next move may need either a pause or a fresh burst of buying to keep going.
That is where the MACD matters. The MACD at 3.011 is above the signal line at 2.553, with a positive histogram of 0.457. This shows trend momentum is still expanding rather than fading. In other words, the oscillator set is not giving a bearish reversal warning yet; it is telling us the trend is hot, and hot trends can stay elevated for longer than many expect.
As shown in the chart, the tension is between stretched short-term readings and still-positive trend confirmation.
That mix often produces choppy trading: strong enough to resist a deep drop, but overbought enough to make fresh highs harder to sustain without pauses.
Volatility & Volume
Volatility is not flashing a breakout warning. The Bollinger Band width is 8.6%, described as normal, which suggests the market is not in a compressed “coiled spring” phase that often precedes a sharp expansion. Price is near the top band at HKD 158.27, while the middle band sits at HKD 151.70 and the lower band at HKD 145.14. That placement reinforces the idea that the stock is trading with upward bias, but also that it is already stretched toward the upper edge of its statistical range.
The ATR(14) at 2.64, or 1.7% of price, points to moderate volatility. For readers, ATR is a measure of typical daily movement. A moderate reading means the stock can still swing meaningfully, but not in a disorderly way. That is useful context here: the market is not calm, but it is also not showing the kind of volatility spike that often accompanies panic or euphoria.
Volume adds a slight caution. Last trade volume was 12,386,814, below the 20-day average of 13,636,168, or about 0.9x normal. That means the latest advance has not been powered by unusually heavy participation. Still, OBV is rising, which signals that cumulative volume has been supportive of the uptrend over time. In simple terms, the stock has not lost sponsorship, but the latest push higher is not yet backed by a surge in turnover.
Key Levels & Scenarios
The nearest technical floor is the support at HKD 147.60, while the immediate ceiling is the resistance at HKD 157.80. Those levels sit inside a wider 3-month range of HKD 133.50 to HKD 158.40, and that upper boundary is especially important because price is now only a small step away from it. A move through HKD 157.80 would place the stock into fresh range-high territory, but without stronger volume, such a move could still be vulnerable to profit-taking. If the stock fails to hold HKD 147.60, the chart would begin to lose the higher-low structure that has supported the uptrend.
Last price: HKD 156.50 sits just below the immediate resistance, so the market is effectively testing whether momentum can outrun overbought readings.
Technical Verdict: HOLD (wait & see)
HOLD (wait & see)
- RSI at 71.5 and Stochastic at 95.1 / 92.6 show the stock is overbought, so upside may need a pause before extending further.
- MACD remains positive with the histogram above zero, which supports the trend and prevents a bearish call.
- Price above SMA20 and SMA50, plus OBV rising, confirms the broader uptrend is still intact.
- Verdict invalidated if price falls below HKD 147.60, because that would break the nearest support and weaken the current higher-low structure.
- Ideal Entry Range: HKD 151.70 to 147.60
- Exit Target: HKD 157.80 to 158.27
- Stop Loss protection: below HKD 147.60
In plain English: the trend is still up, but the stock looks stretched enough that patience matters more than chasing strength.
Summary Data HSBC
| Last price | 156.50 HKD |
| Change 1 day / 5 days / 1 month | -0.25% / 1.76% / 5.03% |
| Trend / MA-cross | uptrend / none |
| SMA20 / SMA50 | 151.70 / 146.41 |
| RSI (14) / Stochastic %K | 71.5 / 95.1 |
| Bollinger %B / ATR | 87% / 2.64 |
| Support / Resistance 20 days | 147.60 / 157.80 |
| Data as of | 20 Juli 2026 08:30 WIB |


