HSBC Stock Gains 1.15% Today, Testing Key Resistance
On Juli 22, 2026: price 1,509.40 GBp, trend uptrend, RSI 60.5, support 1,422.60, resistance 1,493.80. technical analysis of hsbc stock.

At 1,509.40 GBp, HSBC Holdings is trading above its short- and medium-term trend lines and has pushed beyond the top of its Bollinger band, a sign that the shares are extending a move that is already well established rather than starting one from scratch. The stock is up 1.15% on the day, 3.24% over five days and 4.00% over one month, with the price now above both the SMA20 at 1,456.67 and the SMA50 at 1,405.12. That alignment matters because it shows the market is still paying up for the shares on both a tactical and a broader trend basis, while the absence of a fresh moving-average cross suggests the current advance is being carried by continuation rather than a new signal.
The catch is that HSBC is no longer sitting comfortably inside its recent range. It is trading above the 20-day resistance at 1,493.80 and above the upper Bollinger band at 1,500.32, with %B at 110%. In plain terms, the price is trading outside the band that usually contains most of the action, which often happens when momentum is strong but can also mean the move is getting stretched. The Bollinger band width has narrowed to 6.0%, a squeeze that often precedes a larger swing. That combination — breakout-like price action inside a compressed band — is why the market is likely watching whether HSBC can hold the new level or slip back into the prior range.
Trend & Price Action
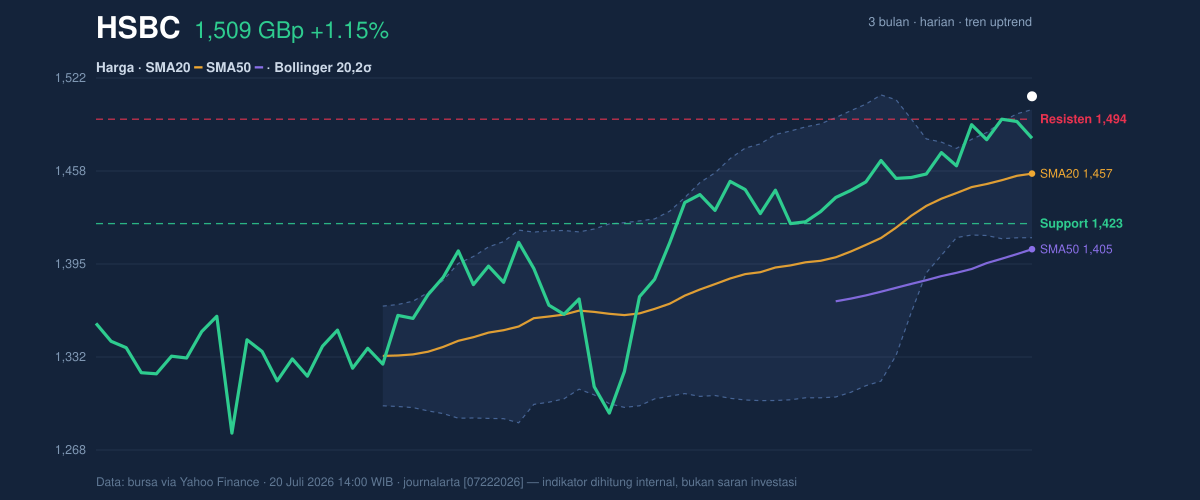
The chart shows a stock that has spent the recent period climbing above its trend averages, with the price above SMA20 and SMA50 confirming that buyers remain in control. The SMA20 slope of 0.92% over five days is important because it tells readers this is not a flat, indecisive market; the short-term average is still rising, which usually supports further follow-through if demand persists. The share price is also sitting at 122% of the 20-hour range, meaning it is near the upper end of the recent trading band rather than in the middle. That is constructive for trend traders, but it also leaves less room for error if the stock loses momentum.
The broader 3-month map adds context. HSBC is below the 3-month high of 1,590.00 but well above the 3-month low of 1,256.20, so the stock is recovering, not breaking out into completely new territory. That matters because markets often stall when they approach prior highs, where investors who bought earlier may choose to take profits.
Short and sharp: the trend is up, but it is now being tested near the top of its recent lane.
Oscillators & Momentum
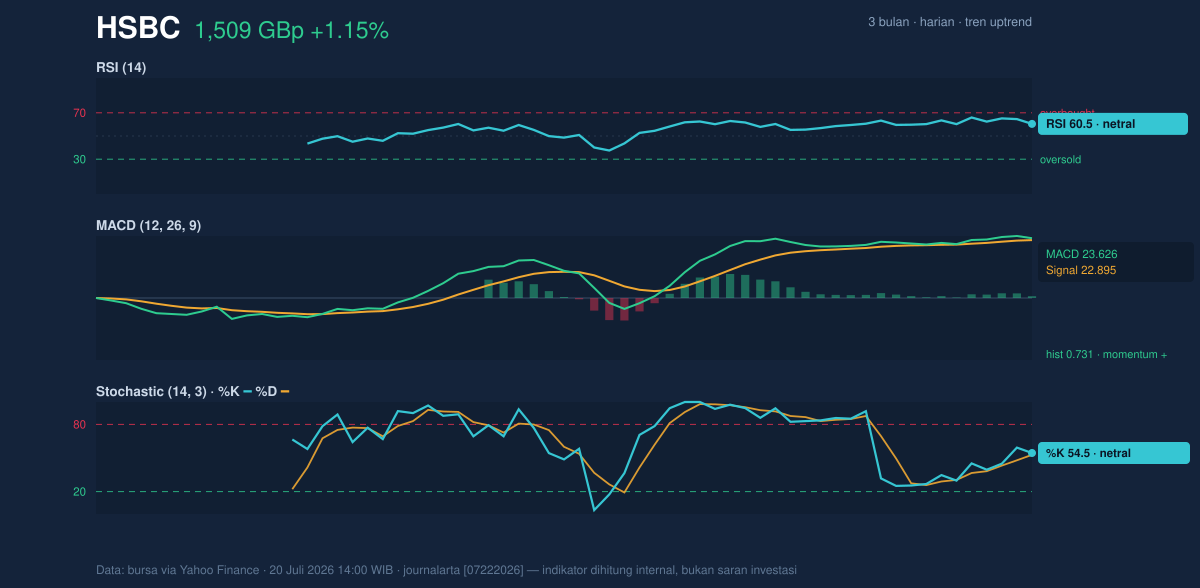
Momentum indicators are supportive, but not euphoric. The RSI at 60.5 is best read as neutral-to-firm rather than overbought, which means the move has room left before it becomes technically overheated. The Stochastic %K at 54.5 and %D at 52.9 also sit in neutral territory, showing that the latest rise has not yet forced the stock into an extreme condition. In simple terms, these oscillators are confirming the uptrend without flashing a warning light.
The MACD at 23.626 above the signal line at 22.895, with a 0.731 histogram, is the cleaner bullish read in the set. MACD compares two moving averages to gauge whether momentum is speeding up or slowing down; here, it says the trend still has positive energy behind it. The key point is that momentum is positive, but not stretched enough to suggest a blow-off move. That makes the current position more credible than a one-day spike, even if the price is already pressing the upper band.
Volatility & Volume
Volatility is moderate rather than wild, with ATR(14) at 42.83, or 2.8% of price. ATR measures the average daily range, so this tells us HSBC is moving enough to matter but not in a disorderly fashion. The narrower 6.0% Bollinger band width adds an important second layer: volatility has compressed even as price has pushed higher, which often means the market is coiling before its next directional move.
Volume, however, is less decisive. The latest turnover of 18,705,672 is only about 1.0× normal, just under the 20-hour average of 19,216,582. That means the price advance is not yet being backed by a clear surge in participation. The OBV is down, and that is the one cautionary signal in the dataset. OBV, or on-balance volume, tracks whether volume is flowing in with price or against it; a falling OBV while price rises can mean the rally is not being broadly confirmed.
So the move is real, but the crowd is not fully chasing it.
Key Levels & Scenarios
The immediate reference points are clear. The 20-hour support at 1,422.60 sits well below the current price and marks the first level where trend followers would want to see buyers reappear. The more immediate hurdle has already been crossed at 1,493.80, and the next visible ceiling is the 3-month high at 1,590.00. Because the stock is already above the upper Bollinger band, a failure to hold above the breakout area could quickly pull it back toward the middle band at 1,456.67, which is also the SMA20.
If HSBC holds above 1,493.80, the chart suggests the market is trying to build a higher platform. If it slips back below that level, the squeeze-breakout setup becomes less convincing and the stock may revert toward its moving-average support.
Technical Verdict: HOLD (wait & see)
HOLD (wait & see)
- MACD is positive, so momentum still favors the upside.
- Price is above SMA20 and SMA50, confirming the broader trend remains constructive.
- RSI and Stochastic are neutral, which says the move is healthy but not yet decisive enough to justify treating the breakout as fully confirmed.
- Verdict invalidated if price falls below 1,422.60, the 20-hour support.
- Ideal Entry Range: 1,456.67 to 1,493.80
- Exit Target: 1,590.00
- Stop Loss protection: 1,422.60
In plain English: HSBC looks technically firm, but the latest push still needs confirmation before the move can be treated as fully established.
At 14:00 WIB on 20 July 2026, HSBC’s latest volume was 18,705,672 shares.
Summary Data HSBC
| Last price | 1,509.40 GBp |
| Change 1 day / 5 days / 1 month | 1.15% / 3.24% / 4.00% |
| Trend / MA-cross | uptrend / none |
| SMA20 / SMA50 | 1,456.67 / 1,405.12 |
| RSI (14) / Stochastic %K | 60.5 / 54.5 |
| Bollinger %B / ATR | 110% / 42.83 |
| Support / Resistance 20 days | 1,422.60 / 1,493.80 |
| Data as of | 20 Juli 2026 14:00 WIB |

