OCBC Stock Technicals Today: Drops 0.17%, RSI Overbought
On Juli 22, 2026: price 28.64 SGD, trend uptrend, RSI 81.5, support 24.66, resistance 28.78. technical analysis of ocbc stock. OCBC Stock Technicals — full…

OCBC Bank’s Singapore-listed shares were last traded at SGD 28.64, down 0.17% on the day, even as the stock remains firmly in an established advance and sits just below its near-term ceiling, according to data from the exchange via Yahoo Finance at 21 July 2026 08:00 WIB. The small pullback matters less than the position of the price itself: OCBC is still trading well above its short- and medium-term averages, which tells the market that buyers have been willing to step in on dips. What stands out now is not the day’s red print, but the fact that the share is operating close to the top of its recent range after a strong one-month gain of 14.24%.
Trend & Price Action
The broader structure remains constructive. OCBC is in an uptrend, with the SMA20 at SGD 26.56 and the SMA50 at SGD 24.84, while price stays above both. That alignment usually signals that shorter-term buying pressure has been strong enough to keep the stock above its recent trend line, and the gap between the 20-day and 50-day averages suggests the move is not a one-day spike but a trend that has been building for weeks. As shown in the chart, the stock is also near the upper end of its 3-month band, with a high of SGD 28.99 and a low of SGD 21.51, leaving limited room before it meets the prior peak.
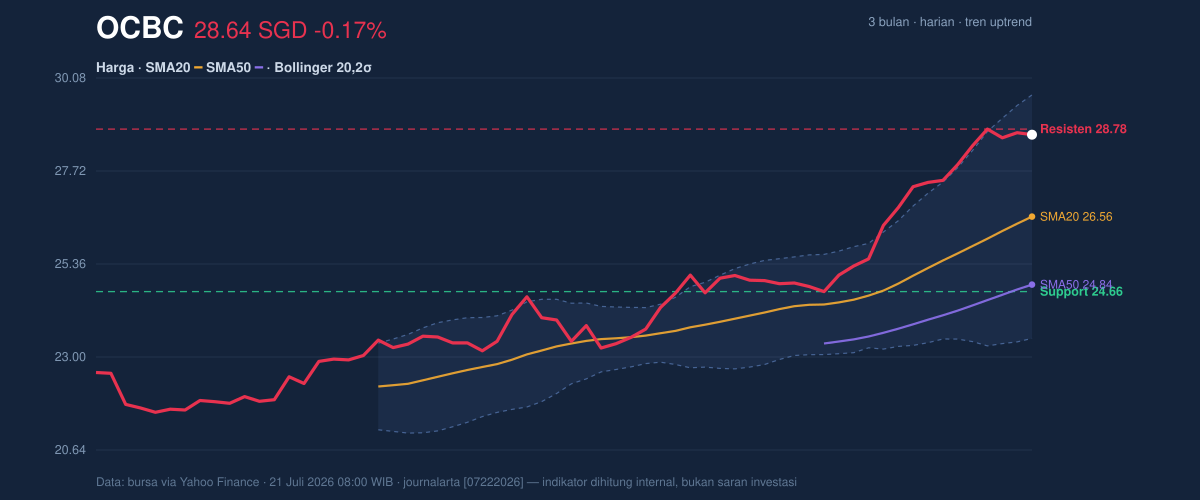
The immediate technical question is whether the shares can absorb supply around the current zone. The 20-hour resistance sits at SGD 28.78, and the last price is already within striking distance of that level. Being in the 97% range of the recent band means OCBC is priced near the top of its short-term corridor, which often makes the next few sessions more sensitive to profit-taking. At the same time, the absence of a fresh MA crossover is not a negative; it simply says the trend is already established, so traders are watching whether momentum can keep extending without a new signal from the moving averages.
Oscillators & Momentum
The momentum picture is strong, but it is also stretched. The RSI at 81.5 and the Stochastic %K at 91.9 / %D at 93.3 both sit in overbought territory, which means the stock has risen quickly enough that short-term enthusiasm may be ahead of immediate room for further gains. In plain language, this does not automatically mean a reversal is due; it means the market has already priced in a good deal of recent strength, so fresh upside may need a pause, consolidation, or another burst of demand to continue.
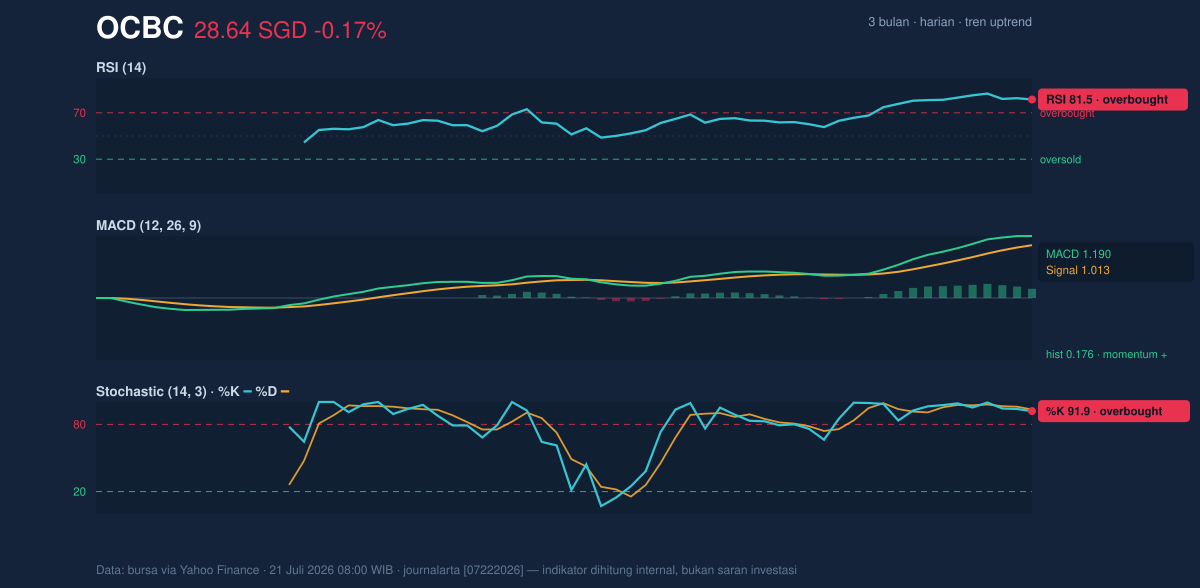
The MACD at 1.190 remains above its signal line at 1.013, with a positive histogram of 0.176. That combination is important because it shows trend momentum is still pointing upward even as oscillators warn of overheating. In other words, the trend is intact, but it is running hot. When RSI and Stochastic are overbought while MACD stays positive, the usual interpretation is not “trend broken,” but “trend extended.” That distinction matters: strong trends can remain overbought for some time, yet they become more vulnerable to sharp pullbacks if buying volume fades.
Volatility & Volume
Volatility has picked up. The Bollinger Bands are widening, with the upper band at SGD 29.65, the middle band at SGD 26.56, and the lower band at SGD 23.48, while the band width stands at 23.2%. A widening band usually signals that the stock is no longer drifting quietly; it is moving with conviction and may continue to swing more sharply in either direction. The %B at 84% shows price is trading close to the upper band, reinforcing the view that OCBC is stretched on the upside rather than building a base in the middle of the range.
The volume data supports the move. Last trading volume was 7,542,400, above the 20-session average of 5,751,799, or about 1.3× normal. That matters because price gains are more credible when they come with participation, not thin turnover. The OBV is rising, which suggests money flow has been accumulating rather than quietly leaking out. ATR at 0.55, or 1.9% of price, indicates volatility is moderate in absolute terms even though the Bollinger Bands are expanding; the stock can move, but not in a wildly disorderly way on an average day.
Key Levels & Scenarios
The nearest support to watch is SGD 24.66, while the immediate resistance is SGD 28.78. Those levels frame the current debate: whether OCBC can clear the ceiling and challenge the SGD 28.99 three-month high, or whether overbought momentum invites a pullback toward the trend base around the middle Bollinger band at SGD 26.56. If the stock pushes through SGD 28.78 with volume staying above average, the chart would suggest the market is willing to test the prior high. If it fails to hold above the current zone, the first sign of cooling would likely be a drift back toward the SMA20 and middle band, where trend followers often reassess.
Technical Verdict: HOLD (wait & see)
HOLD (wait & see)
- RSI at 81.5 and Stochastic at 91.9 / 93.3 show the stock is overbought, so the near-term setup is stretched.
- MACD remains positive with the histogram above zero, confirming the uptrend is still intact.
- Price is near SGD 28.78 resistance and close to the SGD 28.99 3-month high, leaving limited room before the next test of supply.
- Verdict invalidated if price falls below SGD 24.66, which would break the nearest support and weaken the current trend structure.
- Ideal Entry Range: SGD 26.56 to SGD 28.78
- Exit Target (Target Price): SGD 28.99
- Stop Loss protection: below SGD 24.66
In plain English, OCBC still looks strong, but the chart says the shares are already running hot, so the next move is more likely to be a test of whether the market can keep paying up near resistance.
Summary Data OCBC
| Last price | 28.64 SGD |
| Change 1 day / 5 days / 1 month | -0.17% / 2.73% / 14.24% |
| Trend / MA-cross | uptrend / none |
| SMA20 / SMA50 | 26.56 / 24.84 |
| RSI (14) / Stochastic %K | 81.5 / 91.9 |
| Bollinger %B / ATR | 84% / 0.55 |
| Support / Resistance 20 days | 24.66 / 28.78 |
| Data as of | 21 Juli 2026 08:00 WIB |


