Shell Testing Key Resistance: Stock Gains 0.56% (Juli 22, 2026)
On Juli 22, 2026: price 3,254.00 GBp, trend sideways, RSI 63.8, support 2,872.50, resistance 3,236.00. technical analysis of shell stock.

Shell plc edged higher on the London Stock Exchange on 20 July 2026, with the shares at 3,254.00 GBp, up from 3,236.00 at the previous close, as the market pushed the stock just beyond the upper Bollinger band shown in the chart. The move is modest in headline terms, but it matters because it places Shell at the top end of its recent trading range while momentum indicators are no longer fully aligned with the price.
Trend & Price Action
Shell is still described as sideways, yet the price action is leaning upward rather than drifting aimlessly. The shares are trading above the SMA20 at 3,017.75 and also above the SMA50 at 3,108.36, which tells investors the short-term and medium-term trend gauges are both being respected. That is a constructive signal, even without a fresh moving-average cross, because the stock has already reclaimed the levels that typically separate a neutral tape from one with better underlying demand.
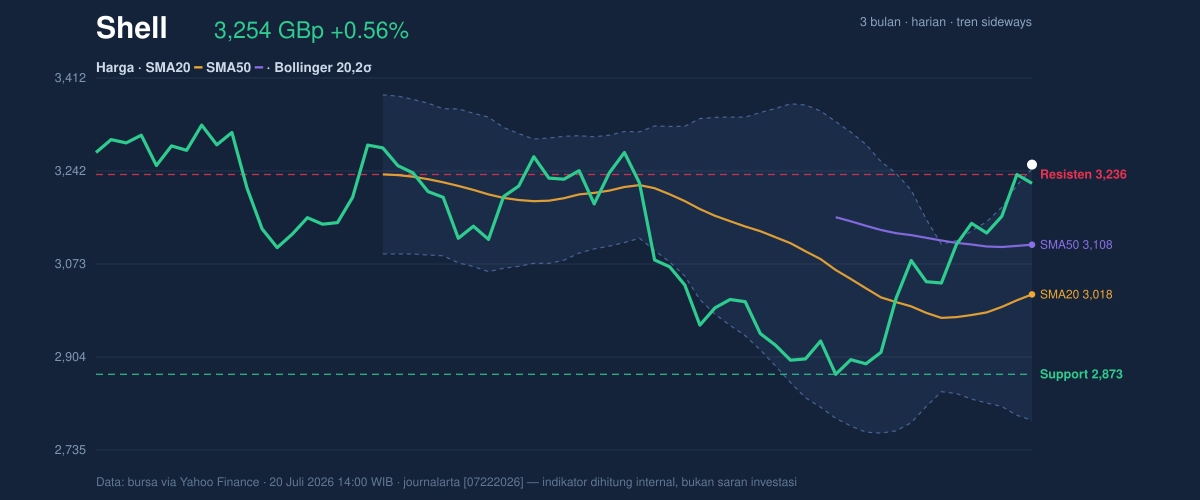
What stands out more is where the price sits inside the recent range. At 3,254.00 GBp, Shell is effectively at 105% of the 20-hour range, above the stated resistance at 3,236.00 and pressing against the upper boundary of the Bollinger structure. In plain English, that means the market has already used up much of the near-term upside room that was visible from recent trading, so further gains may require fresh buying interest rather than just continuation of the current drift.
The broader three-month backdrop remains wide, with the stock still below the 3,758.50 high and well above the 2,559.50 low. That positioning suggests Shell has recovered from the lower end of its recent band, but it has not yet returned to the upper part of the longer range where trend conviction would look stronger.
Oscillators & Momentum
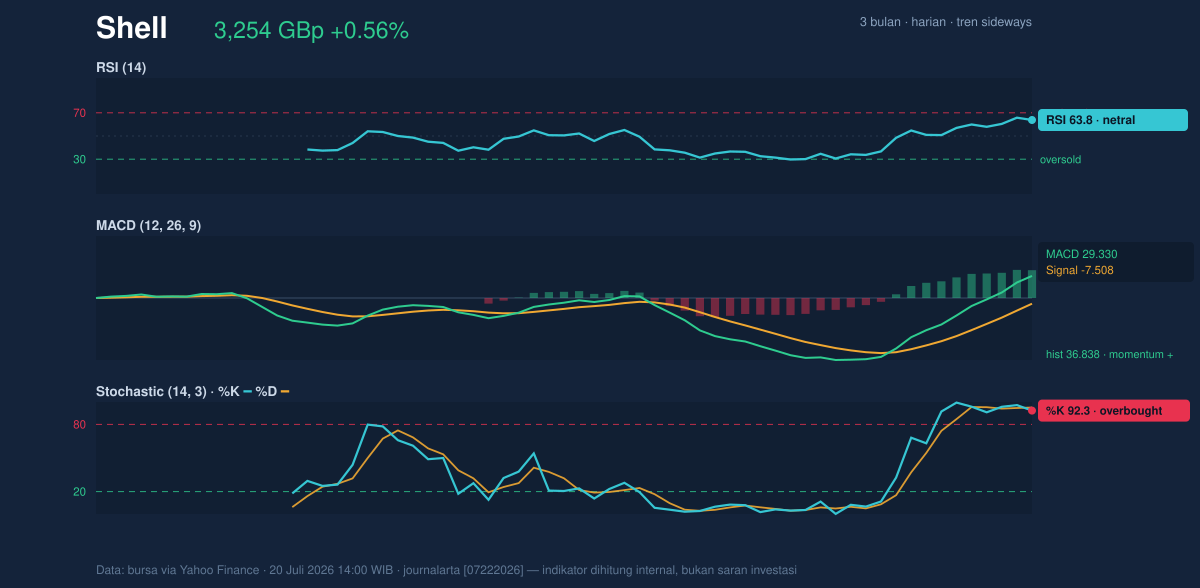
Momentum is mixed, and that is the key nuance in this name right now. The RSI at 63.8 is still neutral, which means the shares are not yet in a classic overbought warning zone on that measure. But the Stochastic %K at 92.3 and %D at 95.1 are both overbought, which usually signals price has moved quickly relative to its own recent history and may be vulnerable to a pause or pullback.
The MACD at 29.330, with the signal line at -7.508 and a histogram of 36.838, is still firmly positive. That matters because MACD is a trend-following gauge, and a wide positive spread usually means the underlying trend is still working even if the move has become stretched. In other words, Shell’s momentum is not broken; it is simply getting more mature, and mature advances often become more sensitive to profit-taking once short-term oscillators reach extreme readings.
Volatility & Volume
Volatility is elevated. The ATR(14) of 138.11, equal to 4.2% of price, indicates the stock can move meaningfully in a single session, so the current level should not be read as static. When ATR is high, price can overshoot support or resistance more easily, and that makes the next few sessions more dependent on whether buyers keep showing up on dips.
The Bollinger bands reinforce that message. Shell is sitting above the upper band at 3,246.82, with the %B at 102%, which means the price is trading slightly outside the normal envelope rather than comfortably inside it. That is often a sign of strength, but it can also mark a short-term exhaustion point when it happens alongside overbought stochastics. The band width of 15.2% is described as normal, so this is not a volatility squeeze that would imply an imminent explosion in range; it is more a case of an already-active stock testing the edge of its recent channel.
Volume does not yet confirm a decisive breakout. Last volume was 7,924,244, below the 20-hour average of 9,202,639, or about 0.9× normal. That matters because a move above resistance is more convincing when it is backed by heavier participation. The positive counterweight is that OBV is rising, which suggests accumulated demand has been improving over time even if the latest session was not especially heavy. Put together, the message is that buyers remain present, but they have not yet arrived in force.
Key Levels & Scenarios
The nearest line in the sand is the already-tested resistance at 3,236.00, now effectively being challenged by the current 3,254.00 GBp price. If Shell can hold above that area, the chart would be confirming that the recent push is more than a brief spike outside the Bollinger band. If it slips back below that level, the move starts to look like a stretch rather than a breakout.
On the downside, the most relevant support is 2,872.50. That is the level where the recent range would begin to look damaged if selling accelerates. The SMA20 at 3,017.75 is also important as a nearer trend reference; if the price falls back through that average after trading above it, the short-term tone would weaken noticeably. The chart therefore suggests a simple technical map: strength above 3,236.00 keeps the move alive, while failure to hold 3,017.75 would signal the rally is losing shape.
Technical Verdict: HOLD (wait & see)
HOLD (wait & see) fits best because the trend is constructive but the momentum is stretched.
- Reason 1: Price is above SMA20 and SMA50, which supports the trend.
- Reason 2: MACD remains strongly positive, showing the broader impulse is still intact.
- Reason 3: Stochastic is overbought and price is above the upper Bollinger band, which warns that the short-term move may be extended.
Verdict invalidated if price falls below 2,872.50, because that would break the nearest stated support and weaken the current structure.
- Ideal Entry Range: 3,017.75 to 3,108.36
- Exit Target: 3,236.00
- Stop Loss protection: 2,872.50
For non-traders, that means Shell’s chart still looks healthy, but the stock is already running hot enough that the next move needs confirmation rather than assumption.
“The market is asking Shell to prove this move is real, not just stretched.”
Summary Data Shell
| Last price | 3,254.00 GBp |
| Change 1 day / 5 days / 1 month | 0.56% / 4.66% / 8.16% |
| Trend / MA-cross | sideways / none |
| SMA20 / SMA50 | 3,017.75 / 3,108.36 |
| RSI (14) / Stochastic %K | 63.8 / 92.3 |
| Bollinger %B / ATR | 102% / 138.11 |
| Support / Resistance 20 days | 2,872.50 / 3,236.00 |
| Data as of | 20 Juli 2026 14:00 WIB |


