T Stock Analysis: Gains 1.41%, Momentum Gains
On Juli 22, 2026: price 22.26 USD, trend sideways, RSI 52.7, support 20.48, resistance 22.81. technical analysis of t stock. Stock Analysis — full details here.

AT&T climbed to 22.26 USD on the NYSE, up 1.41% from the previous close, with the move coming on a sharp volume surge that stood at 1.7x the 20-day average. The stock is not in a clean trend break, but it is pressing against the upper end of its recent range, and that matters: in a sideways tape, a push toward the top of the band often says more about near-term sentiment than about a full-scale trend change.
Trend & Price Action
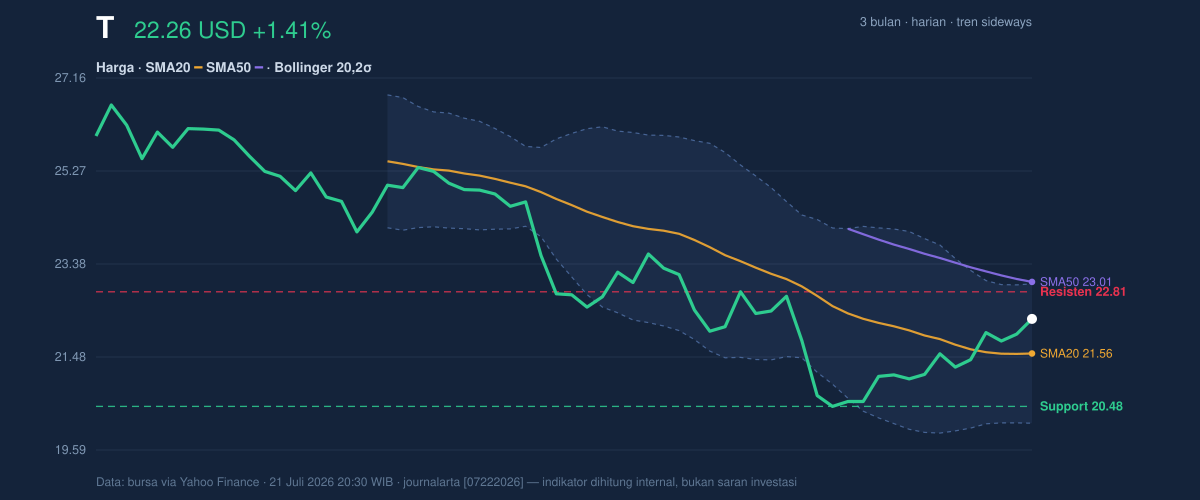
The broader setup still looks sideways. AT&T is trading above its SMA20 at 21.56 but below its SMA50 at 23.01, which is usually the signature of a stock trying to recover short-term momentum without yet reclaiming the longer-term average. In plain language, the price is above the line that tracks the last month of trading, but still under the line that reflects roughly the last two months, so the market is improving without fully resetting its trend.
That gap between the two moving averages is important because there is no new MA-cross to confirm a directional shift. The SMA20 slope of -0.82% over 5 days also shows the short-term average is still leaning lower, even though the stock itself is rising. That combination often signals a market that is stabilizing rather than accelerating.
As shown in the chart, the price is also sitting near the upper part of its recent band, with the 20-hour support at 20.48 and resistance at 22.81. At 76% of the range, AT&T is closer to resistance than support, which means the market has already done a good part of the work needed for this leg higher.
Oscillators & Momentum
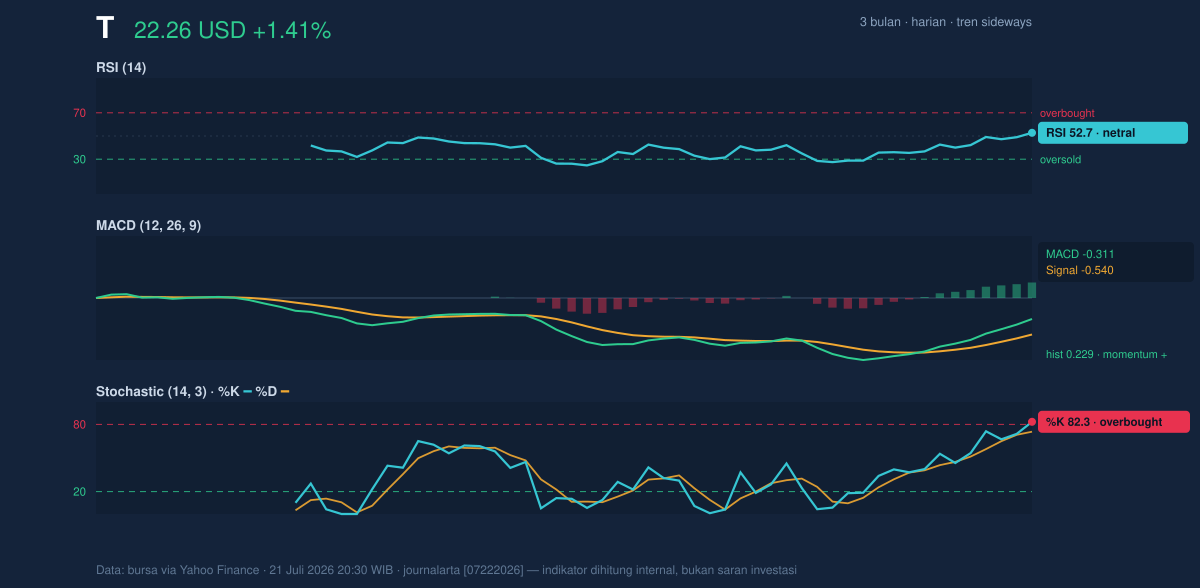
The momentum picture is mixed, and that mix is the story. The RSI at 52.7 is neutral, which means the stock is neither overextended nor washed out. That matters because neutral RSI often leaves room for either continuation or reversal depending on whether other indicators agree.
They do not fully agree. The Stochastic %K at 82.3 and %D at 73.5 are in overbought territory, suggesting the recent move has been strong enough to push the stock into a zone where short-term traders may start taking profits. Overbought does not mean the stock must fall; it means the pace of the rally may be harder to sustain without a pause.
The MACD at -0.311 remains below zero, but the signal line at -0.540 is lower still, leaving a positive histogram of 0.229. That is a constructive shift. In practical terms, MACD is saying downside momentum is fading even though the broader momentum engine has not fully flipped into a strong uptrend. It is a recovery signal, not a full trend confirmation.
As shown in the chart, this is the kind of setup that often produces a “wait and watch” market: the oscillator mix is improving, but the overbought stochastic warns that near-term upside may need fresh volume to keep going.
Volatility & Volume
Volatility is not flashing alarm bells. The ATR at 0.65, equal to 2.9% of the price, points to moderate daily movement. That is enough to allow meaningful swings, but not enough to suggest disorderly trading. The Bollinger Band structure reinforces that view: the bands are fairly normal, with a 13.2% width and the price at %B 75%. In simple terms, AT&T is trading in the upper portion of its volatility envelope, but not in an extreme breakout condition.
The upper Bollinger Band at 22.97 is especially relevant because the stock is now close to it. When price approaches the upper band while stochastic is already overbought, the market often pauses unless volume continues to expand. Here, volume did expand: 139,814,900 shares changed hands versus a 20-day average of 83,659,235, and OBV is rising. That is a meaningful confirmation because rising on-balance volume suggests buyers are not just appearing for one session; they are contributing to the trend in a broader way.
Still, the volume signal should be read carefully. Heavy trading near resistance can mean accumulation, but it can also mean distribution if the stock stalls. The next sessions will show whether the surge is a launchpad or a ceiling test.
Key Levels & Scenarios
The nearest technical ceiling is clear: 22.81 on the 20-hour resistance line, with the Bollinger upper band at 22.97 just above it. If AT&T can hold above that zone, the chart would start to look less like a rebound and more like a challenge to the broader down-sloping average structure.
On the downside, the first line of defense is 20.48. A failure there would put the stock back toward the lower part of its recent range, where the market has already shown it is willing to trade. The broader 3-month low at 19.89 is the deeper level that would matter if risk appetite fades.
The 3-month high at 26.76 remains well above current trading, which underscores how much range remains between recovery and full retracement of the earlier move. For now, the stock sits in the middle of that larger band, but leaning upward.
Technical Verdict: HOLD
HOLD (wait & see)
- The RSI is neutral at 52.7, which does not confirm a stretched move in either direction.
- The MACD histogram is positive at 0.229, showing improving momentum, but the main MACD line is still below zero, so the trend is not fully repaired.
- The Stochastic is overbought and price is already near resistance at 22.81, so upside may need a pause or fresh demand to extend.
Verdict invalidated if price breaks below 20.48.
- Ideal Entry Range: 21.56 to 22.26
- Exit Target: 22.81 to 22.97
- Stop Loss protection: below 20.48
For non-traders, this means the stock is improving, but it has not yet proved that the move can keep going without a pause.
Summary Data T
| Last price | 22.26 USD |
| Change 1 day / 5 days / 1 month | 1.41% / 4.61% / 0.72% |
| Trend / MA-cross | sideways / none |
| SMA20 / SMA50 | 21.56 / 23.01 |
| RSI (14) / Stochastic %K | 52.7 / 82.3 |
| Bollinger %B / ATR | 75% / 0.65 |
| Support / Resistance 20 days | 20.48 / 22.81 |
| Data as of | 21 Juli 2026 20:30 WIB |


