Tencent Stock Gains 2.69%, Momentum Gains In Focus
On Juli 22, 2026: price 474.00 HKD, trend sideways, RSI 57.6, support 411.80, resistance 484.00. technical analysis of tencent stock. Tencent Stock Gains —…

Tencent Holdings rose on the Hong Kong exchange on 20 July 2026, with 0700.HK last at HKD 474.00, up 2.69% from the previous close of HKD 461.60, as the stock pushed deeper into the upper half of its recent trading range. The move matters not just because the shares advanced, but because they did so while sitting above both short- and medium-term averages, a sign that buyers are still willing to pay up even after a month-long 7.68% gain. Still, the chart is not flashing a one-way signal: Tencent is rising inside a sideways structure, which usually means momentum is constructive but not yet decisive.
Trend & Price Action
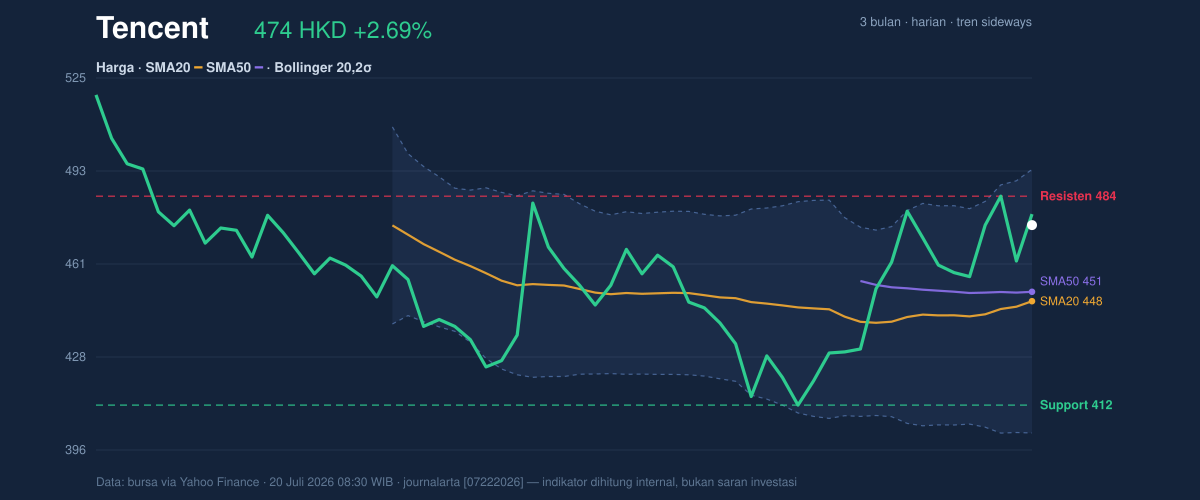
The price is now above the SMA20 at HKD 447.71 and above the SMA50 at HKD 450.98, with no fresh moving-average crossover. That combination is important: when a stock trades above both averages without a new crossover, it often suggests the trend has already improved, but the market is waiting for fresh confirmation rather than celebrating a new breakout. The SMA20 slope of 1.10% over 5 days points upward, yet the broader trend label remains sideways, which tells readers the stock is still moving inside a range rather than launching into a clean directional phase.
The chart also shows Tencent trading near the top of its short-term band structure, at 86% of the 20-hour range. That is a strong position, but it also means less room before the next visible ceiling. The 3-month high at HKD 525.50 remains well above current levels, while the 3-month low at HKD 411.00 sits close to the support zone, framing the stock inside a broad but still active corridor.
A stock can look strong and still be boxed in. Tencent is there.
Oscillators & Momentum
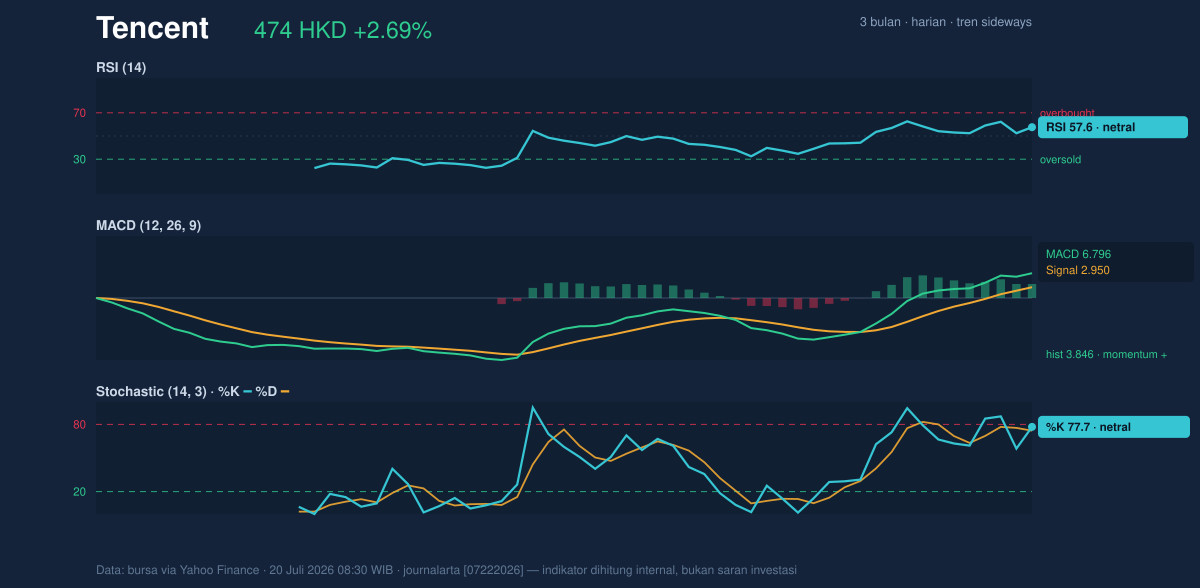
Momentum indicators are mostly supportive, but not stretched enough to imply an immediate reversal risk. The RSI(14) at 57.6 is neutral, which means the stock is neither overbought nor oversold and still has some room to extend before sentiment becomes crowded. The Stochastic %K at 77.7 and %D at 74.4 are also neutral, but they sit near the upper end of their scale, hinting that short-term momentum is firm without yet crossing into an extreme zone.
The clearest positive signal comes from MACD at 6.796, above its signal line at 2.950, with a positive histogram of 3.846. In plain terms, that means recent price action is moving faster than the slower trend measure, and the gap between them is still widening. When MACD is positive while RSI and Stochastic remain neutral, the message is usually that the move has support, but it has not become overheated.
That is the kind of setup traders watch for continuation, not euphoria.
Volatility & Volume
Volatility is elevated, and the Bollinger Bands show it clearly. Tencent’s price is trading below the upper band at HKD 493.26 but well above the middle band at HKD 447.71, with %B at 79%. That means the stock is occupying the upper portion of its volatility envelope, a position that usually reflects ongoing demand. But the 20.3% band width is also expanding, which matters because widening bands often signal that the market is preparing for a larger swing rather than settling into a tight range.
The ATR(14) at 20.23, equal to 4.3% of price, reinforces that point. ATR is a measure of typical daily movement, and at this level it says Tencent can move meaningfully in either direction without breaking character. That makes nearby levels more important than usual.
Volume, however, offers a note of caution. Last trade volume was 30,822,839, below the 20-day average of 37,189,610, or about 0.8x normal. In other words, the price rose without a full-volume stampede. That does not negate the move, but it does mean the advance has not yet been backed by the kind of broad participation that usually confirms a breakout. The OBV is rising, though, which suggests the balance of accumulation still leans positive even if the day’s turnover was light.
Key Levels & Scenarios
The immediate map is fairly clear. Support at HKD 411.80 sits just above the 3-month low of HKD 411.00, making that zone the first real test if sentiment weakens. On the upside, resistance at HKD 484.00 is the nearest barrier, while the Bollinger upper band at HKD 493.26 marks the next volatility ceiling if buyers push through.
If Tencent holds above the SMA20 and continues to trade near the upper half of its range, the chart suggests a move toward HKD 484.00 is plausible. If it fails there, the stock may simply remain range-bound inside the current sideways structure. If price slips back below HKD 447.71, the middle Bollinger band and SMA20 would stop acting as support and the tone would soften quickly. A break under HKD 411.80 would be more serious because it would put the stock back near the lower edge of the 3-month range.
Support: HKD 411.80
Resistance: HKD 484.00
Bollinger upper band: HKD 493.26
Technical Verdict: HOLD (wait & see)
HOLD (wait & see)
- MACD is positive and the histogram remains above zero, which supports the current upward bias.
- Price is above SMA20 and SMA50, but the broader structure is still sideways, so the trend is not fully resolved.
- Volume is below average, meaning the latest advance lacks strong participation even as OBV rises.
Verdict invalidated if price breaks below HKD 411.80.
- Ideal Entry Range: HKD 447.71 to 450.98 on pullbacks toward the moving-average zone
- Exit Target (Target Price): HKD 484.00, with the Bollinger upper band at HKD 493.26 as the next reference
- Stop Loss protection: below HKD 411.80
For non-traders, this means Tencent looks technically firmer than it did a few weeks ago, but it still needs stronger confirmation before the move can be treated as more than an improving range trade.
“The market is saying the stock is healthy, but it has not yet said the rally is real.”
Summary Data Tencent
| Last price | 474.00 HKD |
| Change 1 day / 5 days / 1 month | 2.69% / 3.58% / 7.68% |
| Trend / MA-cross | sideways / none |
| SMA20 / SMA50 | 447.71 / 450.98 |
| RSI (14) / Stochastic %K | 57.6 / 77.7 |
| Bollinger %B / ATR | 79% / 20.23 |
| Support / Resistance 20 days | 411.80 / 484.00 |
| Data as of | 20 Juli 2026 08:30 WIB |


