UOB Stock Gains 0.14%, Momentum Weakens In Focus
On Juli 22, 2026: price 42.72 SGD, trend uptrend, RSI 59.2, support 39.65, resistance 44.95. technical analysis of uob stock. UOB Stock Gains — full details…

United Overseas Bank’s SGX-listed shares traded at SGD 42.72 on 21 July 2026, up 0.14% from the previous close, with the stock sitting above its short- and medium-term trend markers even as momentum has turned less forceful, according to data from Yahoo Finance. The price action is still constructive: UOB is above both its SMA20 at SGD 41.91 and SMA50 at SGD 39.67, which tells traders the broader trend remains upward, but the latest indicators also show the advance is no longer accelerating. In plain terms, the shares are holding their climb, yet they have not broken into a fresh burst of strength.
Trend & Price Action
The chart shows UOB trading in the upper half of its recent range, at about 58% of the 20-day band, with the price still below the upper Bollinger band at SGD 45.71 and above the middle band at SGD 41.91. That placement matters because it suggests the market is neither stretched to the upside nor drifting into breakdown territory; it is simply working through a normal consolidation inside an established uptrend. The uptrend label is supported by the SMA20 slope of 2.28% over 5 days, which indicates the short-term trend line is still rising rather than flattening out.
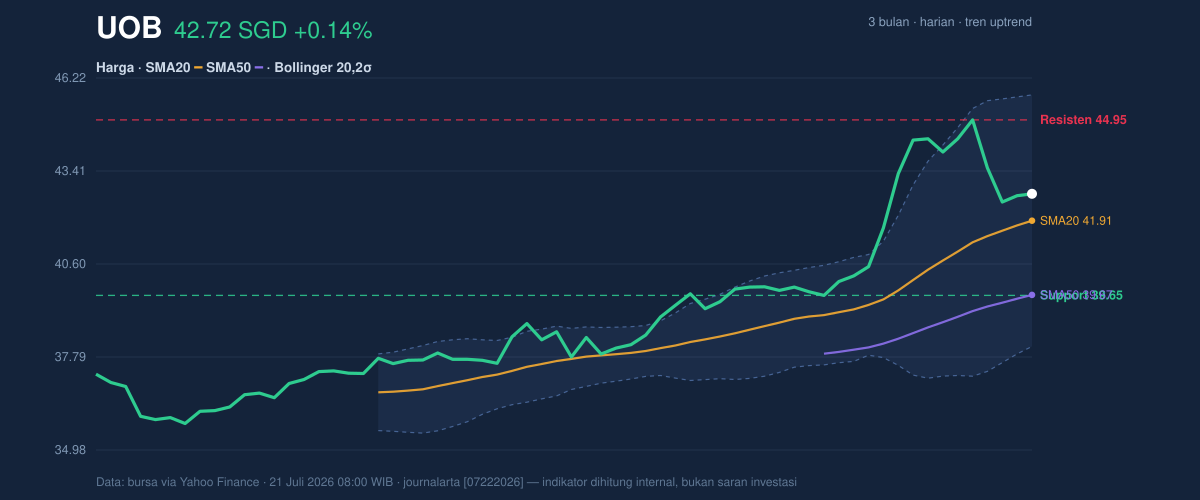
The absence of a fresh MA-cross is also telling. A moving-average cross is often watched as a trend-change signal, but here the picture is more subdued: the faster average is already above the slower one, so the trend has been established, yet there is no new crossover to act as a fresh catalyst. That makes the current setup one of continuation, not acceleration. The stock’s 3-month high of SGD 45.15 sits just above the latest trading zone, while the 3-month low of SGD 35.70 remains far below, underscoring how much of the recent damage has already been repaired.
Oscillators & Momentum
Momentum indicators are mixed rather than bullishly aligned. The RSI at 59.2 is neutral, which means the shares are not overbought and still have room to move higher without immediately triggering exhaustion concerns. The Stochastic %K at 56.5 and %D at 55.0 are also neutral, showing short-term buying pressure is present but not strong enough to signal a breakout. As shown in the chart, both oscillators are hovering near the middle of their ranges, a sign that traders are waiting for clearer direction.
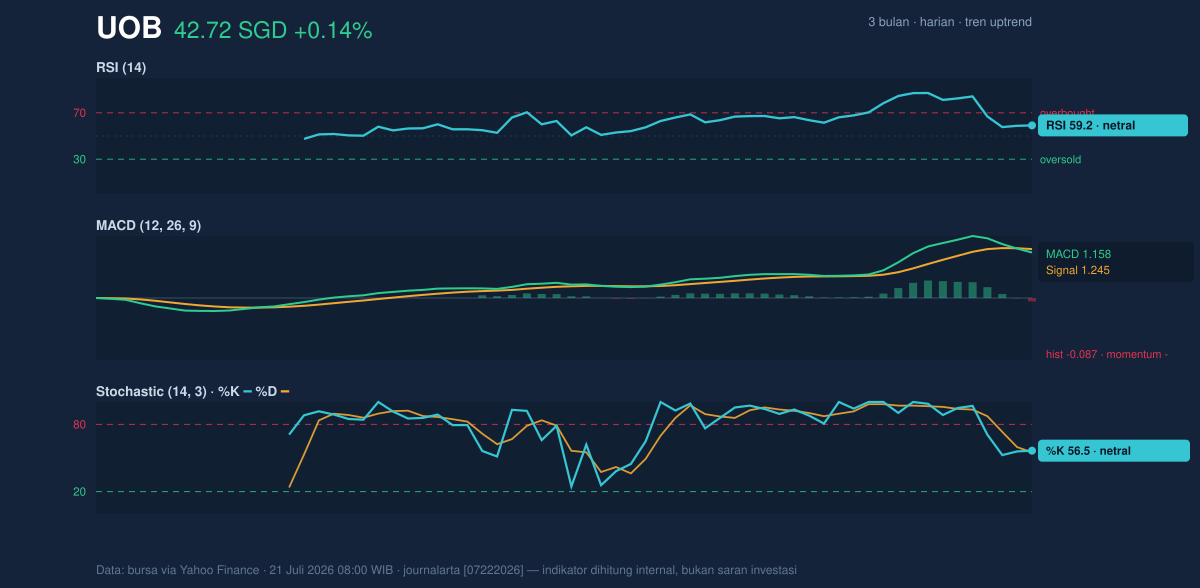
The more important nuance is the MACD at 1.158 versus its signal line at 1.245, with a histogram of -0.087. MACD is a trend-following momentum gauge, and a negative histogram means the shorter-term trend has slipped just below the longer-term trend’s pace. Put simply, UOB is still in an uptrend, but the push is losing some torque. That does not amount to a reversal by itself; it is more consistent with a pause or digestion phase after a month in which the stock gained 7.23%.
Volatility & Volume
Volatility is moderate. The ATR(14) of 0.99, equal to 2.3% of price, suggests the stock typically moves by less than one Singapore dollar in a normal session, which is useful for framing how quickly any breakout or pullback might unfold. Bollinger band width is 18.1%, described as normal, so there is no squeeze implying an imminent volatility expansion, nor a wide, exhausted band structure implying a blow-off move. The %B of 61% adds to that reading: price is above the midline but not pressing the upper envelope, which usually reflects orderly trading rather than speculative excess.
Volume gives a mild confirmation, not a loud one. Latest turnover was 3,511,300, versus a 20-hour average of 3,428,541, so participation was roughly 1.0× normal. That is enough to show the move is not happening on empty tape, but it is not the kind of surge that normally accompanies a decisive trend break. The OBV is rising, though, and on-balance volume matters because it tracks whether buying pressure is quietly accumulating over time. Rising OBV alongside a price holding above its moving averages usually means institutions or larger holders are still net supportive, even if they are not chasing the stock aggressively.
Key Levels & Scenarios
The nearest technical floor is the support at SGD 39.65, while the first meaningful ceiling is the resistance at SGD 44.95. Those levels frame the current debate. If UOB can reclaim and hold above SGD 44.95, the chart would be signalling that recent hesitation has been resolved in favor of the uptrend, with the next reference point being the 3-month high of SGD 45.15. If instead the shares slip back below SGD 41.91, the Bollinger middle band and SMA20 would stop acting as support, and the market would likely shift into a more cautious consolidation. A break below SGD 39.65 would be more serious because it would undercut the recent range structure and challenge the idea that the trend is still comfortably intact.
Technical Verdict: HOLD (wait & see)
HOLD (wait & see) fits the current setup best because the trend is still upward, but momentum is not fully confirming it.
- Reason 1: Price remains above the SMA20 and SMA50, which keeps the broader trend constructive.
- Reason 2: MACD is negative on the histogram, showing momentum has cooled even as price holds up.
- Reason 3: RSI and Stochastic are neutral, meaning there is no strong overbought or oversold signal to force a directional call.
- Verdict invalidated if price falls below SGD 39.65, because that would break the nearest support and weaken the current range structure.
- Ideal Entry Range: SGD 41.91 to SGD 39.65
- Exit Target: SGD 44.95 to SGD 45.15
- Stop Loss protection: below SGD 39.65
In plain English, UOB is still climbing, but the chart says the next move needs confirmation rather than assumption.
Summary Data UOB
| Last price | 42.72 SGD |
| Change 1 day / 5 days / 1 month | 0.14% / -3.74% / 7.23% |
| Trend / MA-cross | uptrend / none |
| SMA20 / SMA50 | 41.91 / 39.67 |
| RSI (14) / Stochastic %K | 59.2 / 56.5 |
| Bollinger %B / ATR | 61% / 0.99 |
| Support / Resistance 20 days | 39.65 / 44.95 |
| Data as of | 21 Juli 2026 08:00 WIB |


