VZ Stock Technicals Today: Gains 0.64%, Momentum Gains
On Juli 22, 2026: price 43.78 USD, trend sideways, RSI 48.1, support 41.99, resistance 46.73. technical analysis of vz stock. VZ Stock Technicals — full…

Verizon Communications rose to 43.78 USD on the NYSE on 21 July 2026, up 0.64% from the previous close, but the move still sits inside a broader sideways pattern that has kept the stock below its 45.62 USD 50-day average. The share price is holding just above the 43.51 USD 20-day average, which matters because it shows buyers are defending the short-term trend line even as the longer trend remains heavier. In plain terms, Verizon is not breaking down, but neither is it yet proving that the recent bounce has enough force to change the larger setup.
Trend & Price Action
The chart shows a stock that is trying to stabilize rather than accelerate.
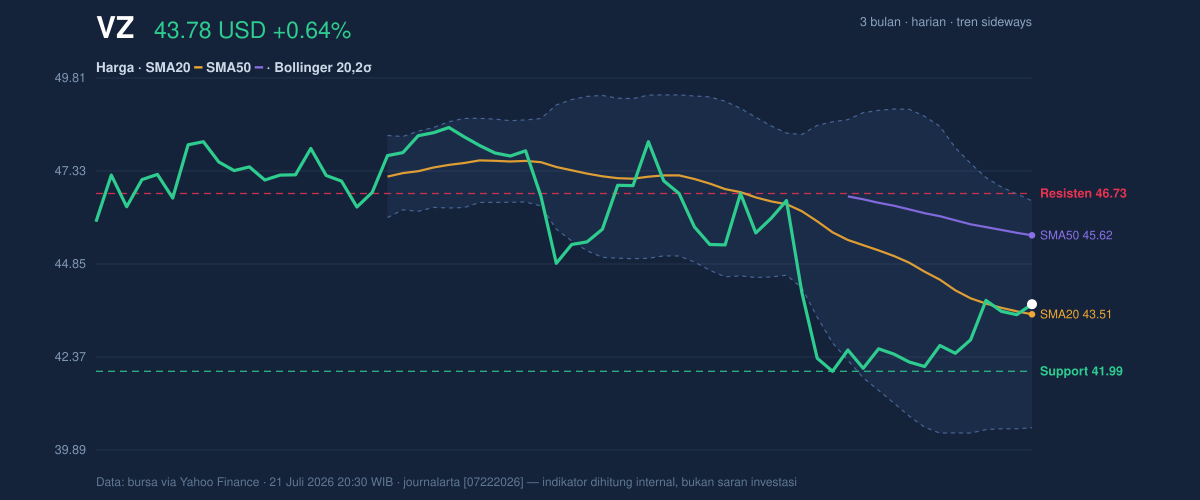
Verizon’s price is trading above SMA20 but below SMA50, a combination that usually signals a market in transition rather than a clean trend. The 20-day average is edging lower, with a -1.45% slope over five days, and that decline explains why the stock can rise in the short run without yet escaping the broader range. A falling short-term average often means rallies are meeting supply quickly, especially when the stock is still below a longer average that acts as a ceiling.
The position inside the recent range also matters. At 43.78 USD, Verizon is sitting around 38% of the way from the 20-hour support at 41.99 USD to resistance at 46.73 USD. That placement says the rebound has improved sentiment, but it has not reached the upper half of the range where momentum usually becomes convincing. The three-month high at 48.96 USD and low at 40.76 USD frame the current move as a recovery from weakness, not a breakout from strength.
Oscillators & Momentum
The momentum gauges are not flashing danger, but they are not yet shouting conviction either.
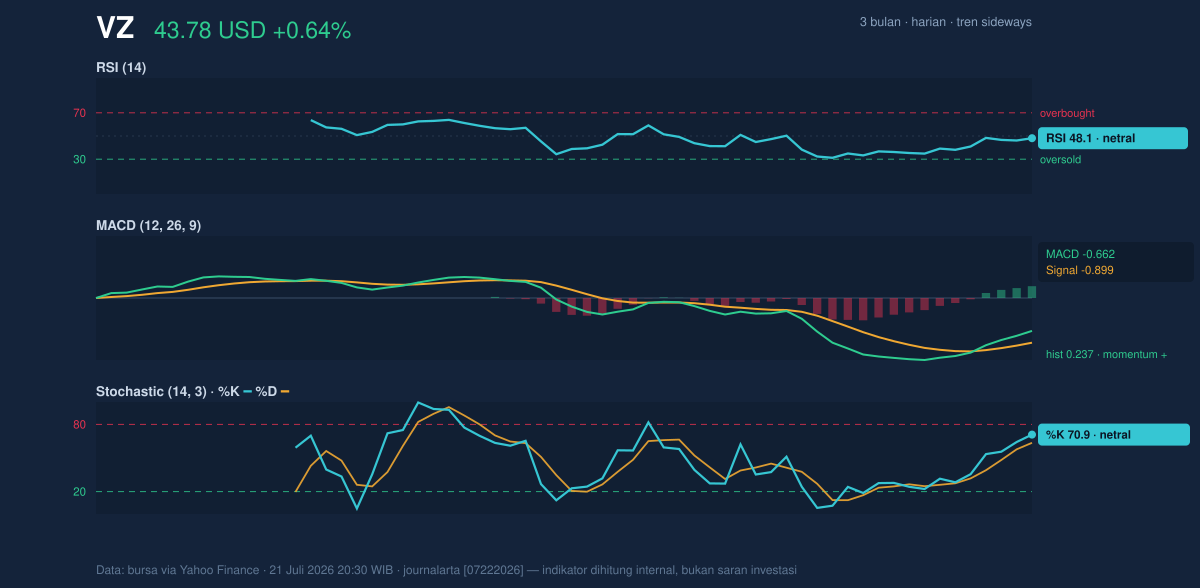
RSI at 48.1 is neutral, which means the stock is neither overbought nor oversold. That is important because it suggests the latest rise has not become stretched; there is room for further movement if buyers keep showing up. At the same time, neutral RSI also tells us the market has not built the kind of pressure that typically accompanies a strong trend shift.
The stochastic reading is a little more constructive. Stochastic %K at 70.9 above %D at 63.6 suggests near-term upward momentum is still intact, but the pair is approaching territory where rallies can start to lose steam if price fails to extend. In practical terms, this is more a sign of a short-lived push than a confirmed breakout signal.
The MACD is the most encouraging of the three. MACD at -0.662 remains below zero, so the longer trend is still not fully repaired, but the line is above the -0.899 signal line and the 0.237 histogram is positive. That setup means downside momentum has eased and the stock has a modest positive impulse. It is a better sign than a simple price bounce, because it shows the move is being supported by improving internal momentum rather than just a one-day reaction.
Volatility & Volume
Volatility is present, but not extreme. The ATR at 1.18, or 2.7% of price, points to a market that can move, yet not in a disorderly way. The Bollinger Bands are also telling a useful story: price sits near the middle band at 43.51 USD, with the upper band at 46.54 USD and the lower band at 40.48 USD. The 54% %B reading means the stock is slightly above the midpoint of its recent volatility envelope, which is consistent with a recovery phase rather than an overextended rally. The 13.9% band width is normal, so there is no squeeze suggesting an imminent explosive move, and no expansion implying panic or breakout conditions.
Volume weakens the case for a strong trend change. Last trading volume was 20,336,700, below the 33,420,790 average by a factor of 0.6x. That means the rebound is happening without broad participation, which often limits how far a move can travel. The declining OBV, or on-balance volume, reinforces that caution: even when price lifts, the underlying flow of shares has not yet turned decisively positive. As shown in the chart, this is the kind of setup where price can drift higher, but confirmation is still missing.
Key Levels & Scenarios
Support at 41.99 USD is the first level that matters for the current bounce. If that floor holds, the stock can continue to work higher inside the range. If it fails, the market is likely to revisit the lower part of the three-month band near 40.76 USD, where buyers previously stepped in.
On the upside, 46.73 USD is the immediate resistance to watch, with the Bollinger upper band at 46.54 USD sitting just beneath it. That clustering is meaningful: when resistance and the upper volatility band sit close together, they often form a stronger barrier because both trend-followers and mean-reversion traders see the same area. A move through that zone would also help the stock reclaim more of the range and reduce the significance of the 45.62 USD 50-day average overhead.
Technical Verdict: HOLD (wait & see)
HOLD (wait & see)
- MACD is positive versus its signal line, showing improving momentum, but it is still below zero, so the broader trend has not fully turned.
- Price is above SMA20, which supports the short-term rebound, yet price remains below SMA50, keeping the medium-term setup capped.
- Volume is only 0.6x normal and OBV is down, so the move lacks the participation usually needed for a durable breakout.
- Invalidation condition: verdict is invalidated if price falls below 41.99 USD.
- Ideal entry range: 41.99 USD to 43.51 USD
- Exit target: 46.54 USD to 46.73 USD
- Stop-loss protection: 40.76 USD
For non-traders, this means Verizon is improving, but the market still wants proof before treating the rebound as something sturdier.
“Until the stock can hold the higher range, this is still a market asking for confirmation.”
Summary Data VZ
| Last price | 43.78 USD |
| Change 1 day / 5 days / 1 month | 0.64% / 3.08% / -3.48% |
| Trend / MA-cross | sideways / none |
| SMA20 / SMA50 | 43.51 / 45.62 |
| RSI (14) / Stochastic %K | 48.1 / 70.9 |
| Bollinger %B / ATR | 54% / 1.18 |
| Support / Resistance 20 days | 41.99 / 46.73 |
| Data as of | 21 Juli 2026 20:30 WIB |


