XOM Testing Key Resistance: Stock Gains 2.26% (Juli 22, 2026)
On Juli 22, 2026: price 151.71 USD, trend sideways, RSI 66.1, support 136.06, resistance 151.71. technical analysis of xom stock. XOM Testing Key Resistance —…

ExxonMobil rose to 151.71 USD on the NYSE, up 2.26% from the previous close of 148.36, and the move pushed the stock to the top of its recent trading range as energy investors digested a technically stretched but still constructive setup. The chart shows a share price that is above both its short- and medium-term averages, yet momentum is now running hotter than the trend itself, which often matters more than the headline gain.
Trend & Price Action
XOM is still trading in a sideways trend, but it is doing so from a stronger position than it held a few weeks ago. The stock sits above SMA20 at 141.00 and above SMA50 at 146.09, which tells traders that the latest advance has moved price back over both commonly watched trend markers. That matters because moving above these averages usually signals improving sentiment, while staying above the longer average suggests the rebound is not just a one-day spike.
The slope of SMA20 at 1.37% over 5 days shows the short-term trend is tilting upward, even if the broader pattern has not yet broken out of its sideways character. There is no new MA-cross, so this is not a fresh moving-average reversal; instead, it is a continuation move with price pressing into the upper part of its range. As shown in the chart, the stock is now at 100% of its 20-hour range, which means it is testing the ceiling rather than building a base.
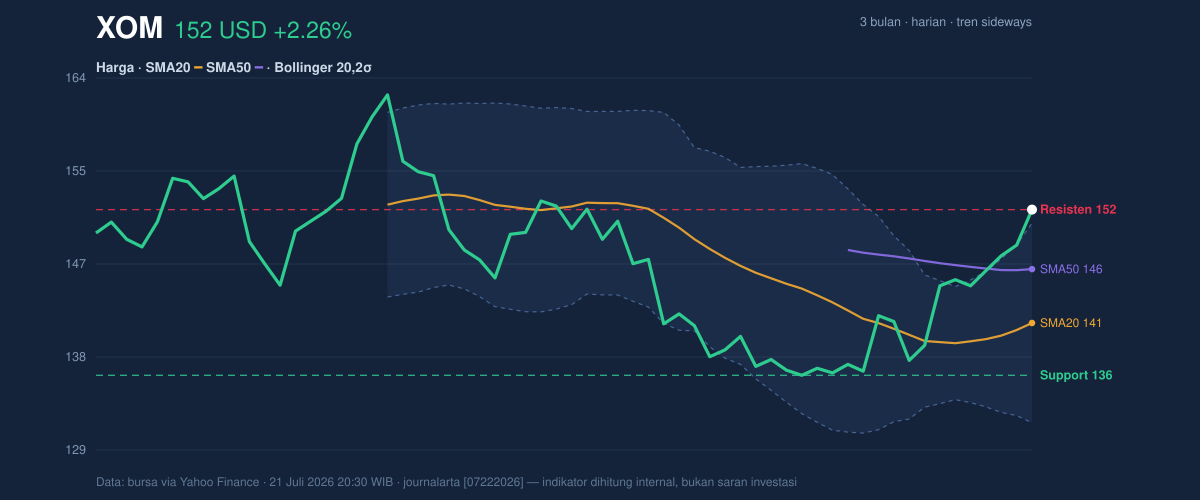
The most important read-through here is that XOM is no longer trading like a laggard, but it is also not yet trading like a clean breakout name. It has climbed from the 3-month low of 134.95 toward the 3-month high of 163.68, and that mid-to-upper range position usually attracts both trend followers and profit takers at the same time.
Oscillators & Momentum
Momentum is the part of the story that looks strongest, and also the most stretched. The RSI(14) at 66.1 is still described as neutral in the data, but it is close enough to the overbought zone to show the stock has gained speed. More telling is the stochastic reading, where %K at 99.7 and %D at 90.2 indicate the stock is deeply overbought in the short term. In plain English, that means prices have risen fast enough that they may need to pause before they can continue higher.
The MACD at 1.102 versus a signal line at -0.604, with a histogram of 1.706, is a stronger bullish signal. MACD measures whether recent price acceleration is beating the slower trend, and this wide positive spread says the upward push is still in force. The key point is that momentum and trend are aligned, but the oscillators are warning that the move is extended.
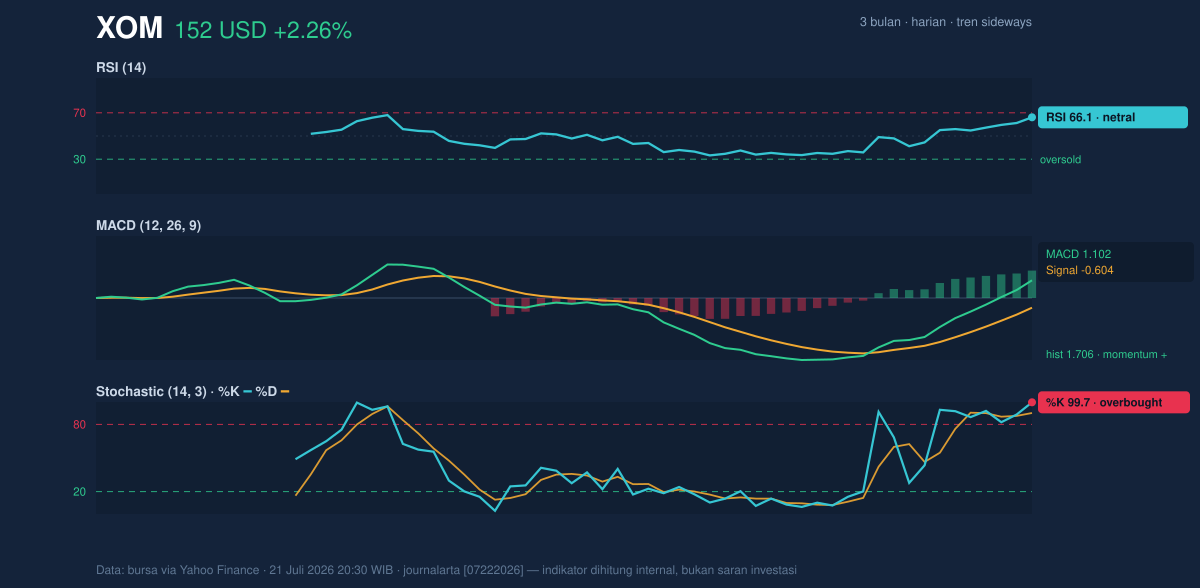
That combination is often what traders call a “strong but tired” setup. It does not automatically mean reversal, but it does mean the next leg higher may require either fresh volume or a brief reset in price first.
Volatility & Volume
Volatility is not flashing panic. ATR(14) at 3.26, or 2.1% of price, suggests movement is active but still manageable, while the Bollinger band width of 13.4% is described as normal. That matters because a normal-width band implies the stock is not coiled for an explosive squeeze; instead, it is trading in a fairly standard volatility regime. The catch is that price is now above the upper Bollinger band at 150.42, with %B at 107%, which means the stock is trading beyond the upper envelope of its recent distribution.
That is usually a sign of strength, but it also often precedes short-term mean reversion. In other words, the market is paying a premium relative to its recent average, and that premium can either grow if buyers keep pressing or shrink if momentum cools.
Volume adds a nuance. The latest volume of 13,140,400 was below the 20-day average of 15,481,045, or about 0.8x normal, so the advance was not backed by unusually heavy participation. Yet OBV is rising, which means cumulative volume flow is still improving even if the latest session was not a volume surge. That is a constructive sign, but not the kind that usually confirms an immediate breakout with conviction.
Key Levels & Scenarios
The nearest support on the data is 136.06, which lines up as the first obvious floor if the current advance loses steam. The most visible resistance is the current price itself at 151.71, while the broader upside reference is the 3-month high at 163.68. With price already above the Bollinger upper band at 150.42, the stock is effectively testing whether buyers can convert a stretched move into a new range.
If XOM can hold above 150.42 and continue to respect 151.71 as a pivot, the chart remains constructive. If it slips back below the upper band and loses short-term momentum, the market would likely refocus on the 141.00 SMA20, then the 136.06 support. The fact that price is currently near the top of its range means the burden of proof is on buyers, not sellers.
Technical Verdict: HOLD (wait & see)
HOLD (wait & see)
- MACD is positive and the histogram is wide, which supports the up-move.
- Price is above SMA20 and SMA50, showing the trend has improved.
- Stochastic is overbought and price is above the upper Bollinger band, which warns of near-term exhaustion.
Verdict invalidated if price falls below 136.06, the nearest support level in the data.
- Ideal Entry Range: 141.00 to 146.09
- Exit Target: 163.68
- Stop Loss protection: 136.06
In plain English, the chart says ExxonMobil is strong enough to stay interesting, but stretched enough to justify patience rather than urgency.
The next technical test is whether the stock can hold above 150.42 without losing momentum, with the next scheduled reference point being any move back toward the 163.68 3-month high.
Summary Data XOM
| Last price | 151.71 USD |
| Change 1 day / 5 days / 1 month | 2.26% / 4.56% / 9.56% |
| Trend / MA-cross | sideways / none |
| SMA20 / SMA50 | 141.00 / 146.09 |
| RSI (14) / Stochastic %K | 66.1 / 99.7 |
| Bollinger %B / ATR | 107% / 3.26 |
| Support / Resistance 20 days | 136.06 / 151.71 |
| Data as of | 21 Juli 2026 20:30 WIB |


