BP Stock Technicals Today: Gains 3.33%, Testing Key Resistance
On Juli 23, 2026: price 539.30 GBp, trend sideways, RSI 62.4, support 455.60, resistance 529.30. technical analysis of bp stock. BP Stock Technicals — full…

International investors are watching BP plc as the shares push into the upper end of their recent range, but the move is being tested by stretched short-term momentum rather than broad trading participation.
BP’s London-listed shares were last at 539.30 GBp on 21 July 2026 at 14:00 WIB, up 3.33% on the day and 8.15% over one month, according to the exchange data cited via Yahoo Finance. That puts the stock above both its SMA20 at 488.15 and SMA50 at 515.51, which is usually a sign that the medium-term price trend has improved. But the context matters: the broader trend is still described as sideways, and the shares are now trading above the upper Bollinger band, which often signals an extended move rather than a clean breakout.
Trend & Price Action
As shown in the chart, BP is trading in the upper half of its recent structure and above the main moving averages, which tells traders that buyers have had the upper hand in the last few sessions. The key point is not just that price is higher; it is that it is now above the 20-day average and above the upper Bollinger band at 531.79, a level that typically marks the edge of the normal trading envelope.
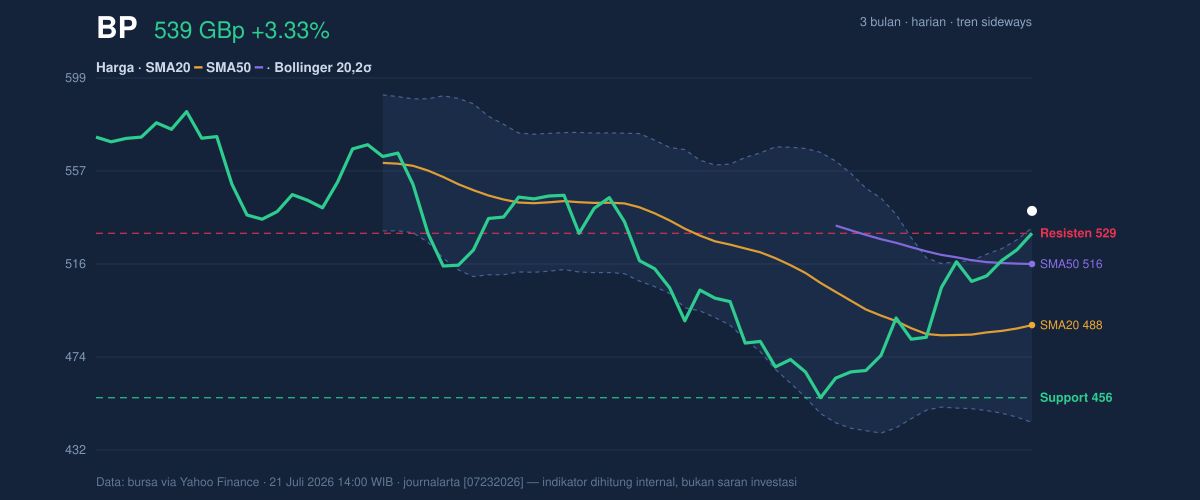
The stock’s position within the recent range is also important. The 20-hour support at 455.60 and resistance at 529.30 frame the current move, and the latest price is already at 114% of that range. In plain language, BP has moved beyond the zone where recent trading has been concentrated. That can be a sign of strength, but it can also mean the move is becoming harder to sustain without fresh buying.
The three-month high at 592.00 remains the next obvious reference point on the upside, while the three-month low at 450.60 shows how far the stock would need to retreat before the recent recovery is meaningfully challenged.
Oscillators & Momentum
The momentum picture is more mixed than the price action alone suggests. The RSI at 62.4 is still classed as neutral, so it does not yet signal a classic overbought warning on its own. But the Stochastic reading of 98.1 / 95.0 is firmly overbought, which means the recent rally has moved fast enough that short-term traders may already be crowded into the same direction.
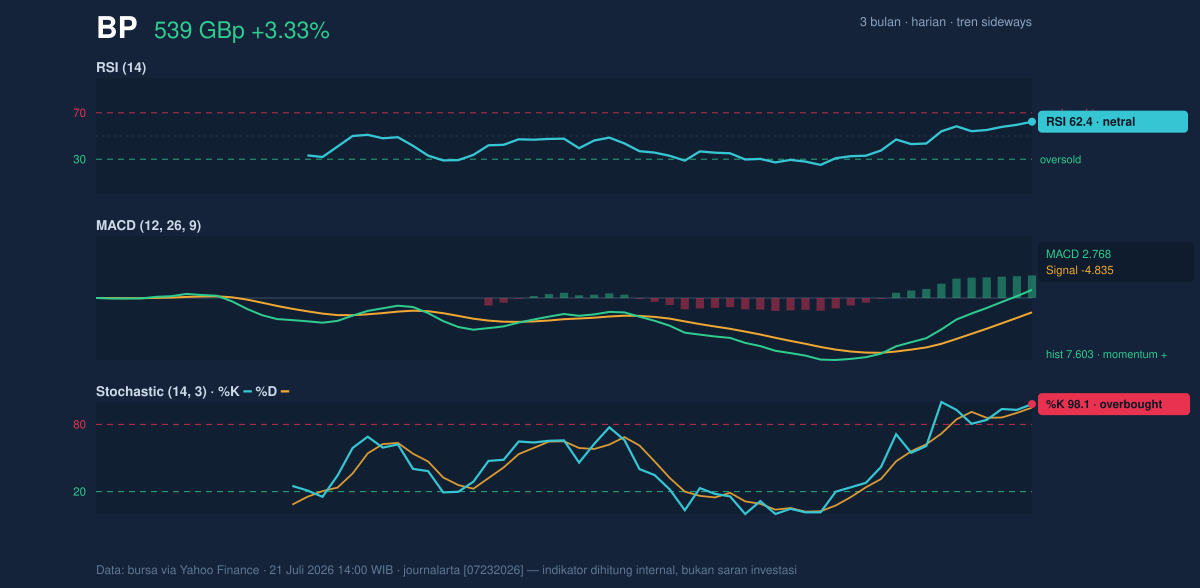
That matters because Stochastic is often more sensitive than RSI to short bursts of strength. In other words, it is telling us that the stock may be running ahead of itself in the very short term, even though the broader momentum trend has not turned negative.
The MACD at 2.768, with the signal line at -4.835 and histogram at 7.603, is still clearly positive. This is the strongest technical confirmation in the dataset: MACD is showing that upward momentum is not just a one-day spike, but still has internal force behind it. The absence of a new MA-cross also means there is no fresh long-term trend signal yet; the move is being driven more by price acceleration than by a structural crossover.
Volatility & Volume
Volatility is present, but not extreme. The ATR at 12.79, equal to 2.4% of price, suggests BP can still move meaningfully in either direction without being erratic. The Bollinger band width of 17.9% is described as normal, so this is not a squeeze setup where a large breakout is being compressed into a narrow range. Instead, the current move looks like a fairly standard expansion within an established trading framework.
The volume picture is less convincing than the price action. Last volume was 29,166,117, below the 20-day average of 39,449,403, or 0.7× normal. That matters because a rally with lighter-than-usual participation can be more vulnerable to fading once short-term buyers step aside. The OBV is rising, which is constructive because it suggests the cumulative flow of volume still leans positive. But the gap between rising OBV and below-average daily volume implies that accumulation is there, just not yet forceful enough to fully validate the latest push.
Key Levels & Scenarios
For traders reading the chart, the most important levels are straightforward. The first support area is the SMA20 at 488.15, which also matches the Bollinger middle band. That makes it a meaningful pivot: if price slips back there, the recent breakout narrative weakens. Below that, the next reference is the SMA50 at 515.51, which has already been surpassed and would now act more as a test of trend durability than a launch point.
On the upside, the immediate hurdle is the 529.30 resistance, which the stock has already moved through. More importantly, the latest close above the 531.79 upper Bollinger band suggests BP is trading in stretched territory. If that extension holds, the market may be signaling a continuation move toward the 592.00 three-month high. If it fails, the price can quickly revert toward the mid-band around 488.15.
Technical Verdict: HOLD (wait & see)
HOLD (wait & see)
- MACD is positive and the histogram remains strongly supportive, which confirms upward momentum is still active.
- Price is above SMA20 and SMA50, showing the stock has improved technically versus its recent averages.
- Stochastic is overbought and price is already above the upper Bollinger band, which raises the risk of a short-term pause or pullback.
- Verdict is invalidated if price falls below 488.15, because that would push BP back under the key 20-day trend anchor.
- Ideal Entry Range: 488.15 to 515.51
- Exit Target: 529.30, then 592.00
- Stop Loss protection: 455.60
In plain English: BP still looks technically constructive, but the latest rise is stretched enough that the chart is asking for confirmation rather than urgency.
Summary Data BP
| Last price | 539.30 GBp |
| Change 1 day / 5 days / 1 month | 3.33% / 4.41% / 8.15% |
| Trend / MA-cross | sideways / none |
| SMA20 / SMA50 | 488.15 / 515.51 |
| RSI (14) / Stochastic %K | 62.4 / 98.1 |
| Bollinger %B / ATR | 109% / 12.79 |
| Support / Resistance 20 days | 455.60 / 529.30 |
| Data as of | 21 Juli 2026 14:00 WIB |


