DBS Stock Gains 2.45% Today, RSI Overbought
On Juli 23, 2026: price 73.66 SGD, trend uptrend, RSI 75.5, support 65.40, resistance 72.98. technical analysis of dbs stock. DBS Stock Gains — full details…

DBS Group shares rose to SGD 73.66 on SGX, up 2.45% from the previous close, and the move matters because it pushed the stock to the top of its recent trading band, just above the 20-day high at SGD 72.98 and even slightly beyond the 3-month high of SGD 73.55. That is a classic sign of strength, but also a warning: when a stock is already near the ceiling of its range, the market is no longer asking whether momentum exists — it is asking whether that momentum can keep extending without pausing. The answer, for now, is mixed.
Trend & Price Action
The broader structure still points higher. DBS is trading above both the SMA20 at SGD 68.86 and the SMA50 at SGD 65.28, which means the short-term trend remains above the medium-term trend and buyers have been in control for several weeks. The SMA20 slope of 2.36% over 5 days confirms that the short-term trend is not just positive, but rising at a healthy pace. There is no new MA-cross, so this is not a fresh breakout signal from the moving averages; rather, it is an established uptrend that is still being carried by follow-through buying.
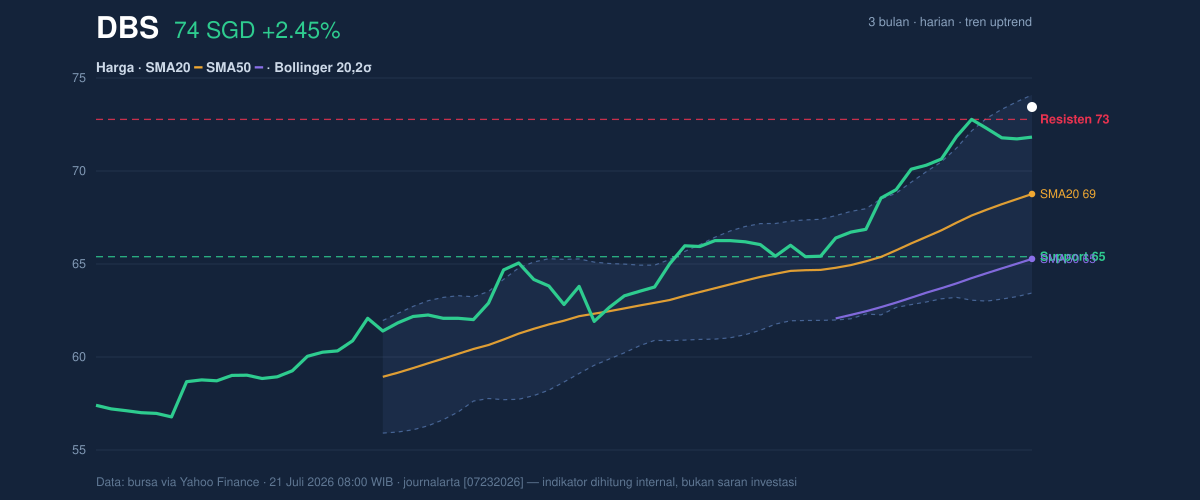
The price position is important. At 109% of the 20-hour range, DBS is effectively pressing against the upper boundary of its recent trading zone. In plain language, that means the stock has already done much of the heavy lifting in the current move. Strong trends can stay extended, but the further price gets from the middle of the range, the more the market tends to test whether late buyers are still willing to pay up. The 20-hour resistance at SGD 72.98 has already been overtaken, which turns that level into the first area traders will watch for signs of acceptance or failure.
Oscillators & Momentum
Momentum indicators are still positive, but they are also flashing the kind of caution that comes when a rally becomes stretched. The RSI at 75.5 is in overbought territory, which does not mean the stock must fall; it means the recent pace of gains has been fast enough that the market may be vulnerable to a pause or pullback. The Stochastic %K at 80.9 and %D at 80.5 are also overbought, reinforcing the message that DBS is trading with strong short-term enthusiasm, but not much room left before momentum starts to look crowded.
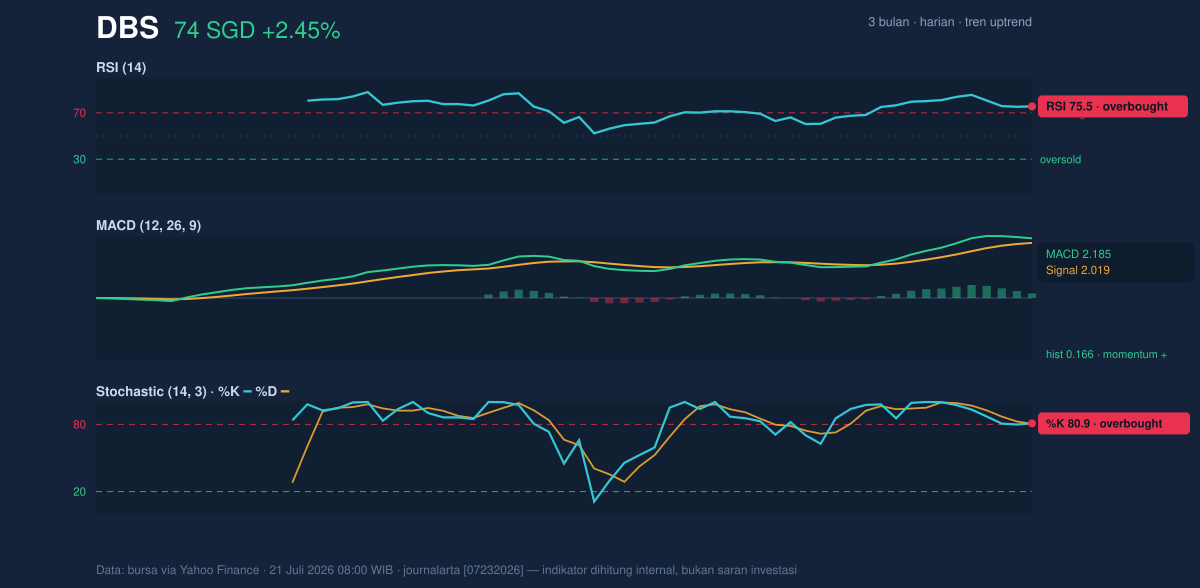
At the same time, the MACD at 2.185 remains above its signal line at 2.019, with a positive histogram of 0.166. That matters because MACD is measuring trend momentum, and here it says the upward push is still intact rather than rolling over. Put simply: the oscillators are not contradicting the trend yet, but they are saying the move is mature. That combination often produces either a brief consolidation or a sharp continuation — and the difference usually depends on whether volume stays supportive.
Volatility & Volume
Volatility is not extreme. The ATR at 1.13, equal to about 1.5% of price, suggests normal daily movement rather than a disorderly swing. That is useful context: DBS is not exploding in a panic move, but advancing with controlled volatility. The Bollinger Bands also help explain the setup. Price is near the upper band at SGD 74.33, with %B at 94%, which means the stock is trading very close to the top of its recent volatility envelope. The band width of 15.9% is normal, not squeezed, so this is not a quiet base waiting for a breakout; it is already a live trend that has moved into the upper extreme.
Volume adds a layer of confirmation. Last turnover of 4,168,300 shares is close to the 20-day average of 3,992,493, or about 1.0x normal. That is enough to validate the move, but not enough to call it a broad-volume surge. The OBV is rising, which is constructive: on-balance volume tracks whether volume is accumulating into strength, and a rising line implies buyers have been willing to support the advance rather than fade it. In other words, the rally has participation, but not yet the kind of explosive backing that usually accompanies a decisive new leg higher.
Key Levels & Scenarios
The immediate technical map is straightforward. The first level to watch is the resistance at SGD 72.98, now effectively a reclaimed area. If DBS can hold above that zone, the market is signalling that the breakout attempt has been accepted rather than rejected. Above that, the next reference is the 3-month high at SGD 73.55, which has already been nudged aside by the latest print at SGD 73.66. The upper Bollinger band at SGD 74.33 is the next volatility ceiling.
On the downside, the first meaningful support sits at the 20-day SMA of SGD 68.86, which also matches the Bollinger middle band. That level matters because it is where the current trend would first be tested if momentum cools. Below that, the more structural floor is the 20-hour support at SGD 65.40, near the SMA50 at SGD 65.28. A move back to that zone would signal that the market has shifted from extension to retracement.
Technical Verdict: HOLD (wait & see)
HOLD (wait & see) — the trend is still upward, but the stock is already stretched at the top of its range and the oscillators are overbought.
- RSI at 75.5 and Stochastic at 80.9/80.5 show the rally is extended.
- MACD remains positive with histogram support, so the trend has not broken.
- Price is above the SMA20 and SMA50, but near the upper Bollinger band at SGD 74.33, where upside can become harder to sustain.
- Invalidation: the verdict weakens if price falls below SGD 68.86, the SMA20 and Bollinger midline.
- Ideal Entry Range: around SGD 68.86 to SGD 72.98, where trend support and prior resistance meet.
- Exit Target: SGD 74.33, the upper Bollinger band, with SGD 73.55 as the nearer reference.
- Stop Loss protection: below SGD 65.40, where the 20-hour support and SMA50 at SGD 65.28 sit.
For non-traders, this means DBS is still moving up, but it is already running hot, so the next move matters more than the last one.
“The stock is strong, but it is now at the point where strength has to prove itself again.”
Summary Data DBS
| Last price | 73.66 SGD |
| Change 1 day / 5 days / 1 month | 2.45% / 2.26% / 11.12% |
| Trend / MA-cross | uptrend / none |
| SMA20 / SMA50 | 68.86 / 65.28 |
| RSI (14) / Stochastic %K | 75.5 / 80.9 |
| Bollinger %B / ATR | 94% / 1.13 |
| Support / Resistance 20 days | 65.40 / 72.98 |
| Data as of | 21 Juli 2026 08:00 WIB |


