HSBC Testing Key Resistance: Stock Gains 0.70% (Juli 23, 2026)
On Juli 23, 2026: price 158.90 HKD, trend uptrend, RSI 66.0, support 147.60, resistance 157.80. technical analysis of hsbc stock. HSBC Testing Key Resistance —…

HSBC Holdings rose to 158.90 HKD on HKEX in the latest session, up 0.70% from the previous close of 157.80, and the move leaves the stock pressing against the top of its recent trading envelope. The share price is now sitting above the 20-day moving average at 152.13 and well clear of the 50-day moving average at 146.67, a setup that still points to an intact uptrend. But the chart also shows a more cautious detail: price is already trading beyond the 20-day Bollinger upper band at 158.77, which often means momentum is strong, yet also stretched.
Trend & Price Action
The broader structure remains constructive. HSBC is in an uptrend, with the SMA20 rising 1.56% over 5 days, a sign that the short-term trend is still sloping higher rather than flattening out. Price is not merely above the moving averages; it is holding a meaningful gap above both the 20-day and 50-day lines, which tells investors that recent buying has been strong enough to keep pullbacks shallow. The absence of a new MA cross matters here: there is no fresh bullish crossover to celebrate, but there is also no sign that the trend has rolled over. As shown in the chart, the stock is now trading at 111% of its 20-day range, with the 20-day support at 147.60 and the 20-day resistance at 157.80 already surpassed.
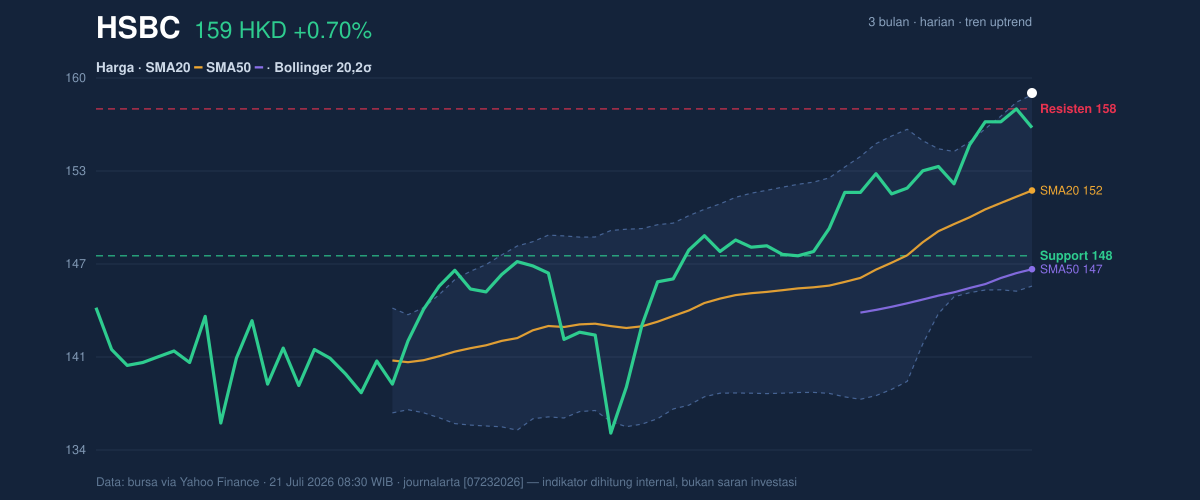
The three-month range adds another layer. HSBC is just above its 3-month high of 158.40 and far above the 3-month low of 133.50, which means the market has already repriced the stock materially higher over that window. That proximity to a fresh high often attracts momentum-following flows, but it also leaves less room for error: once a stock is this close to the top of its range, the next move tends to be driven by whether buyers can keep absorbing any profit-taking.
Oscillators & Momentum
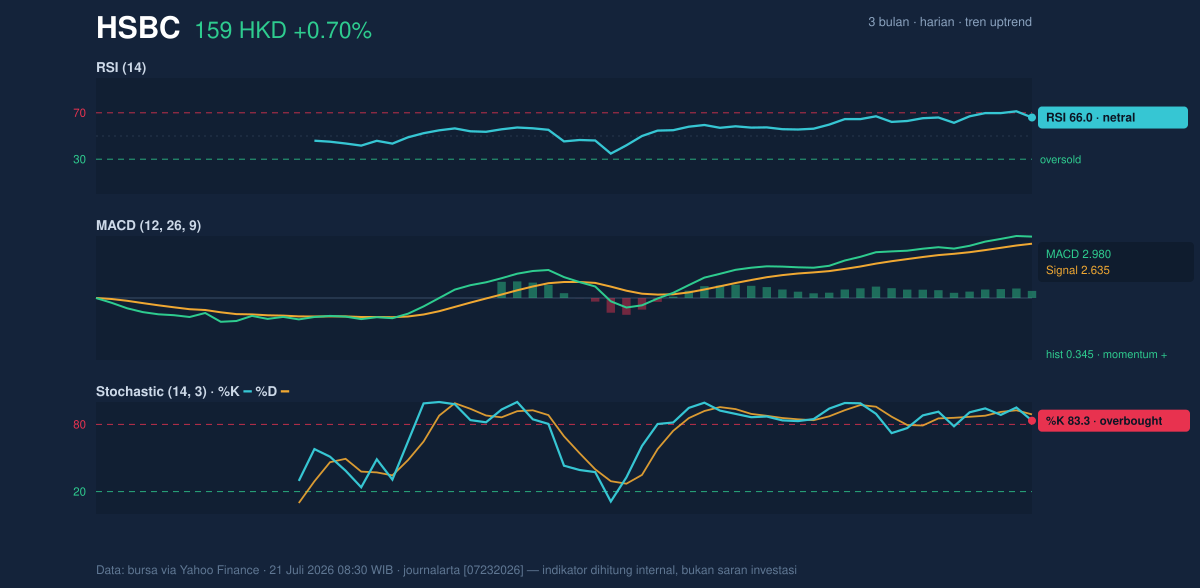
Momentum is positive, but not uniformly so. The MACD at 2.980 sits above its signal line at 2.635, with a 0.345 histogram, which means the trend’s internal momentum is still expanding rather than fading. In plain language, the MACD is saying the recent rise has enough force behind it to remain in gear. The other oscillators are more mixed. The RSI at 66.0 is still described as neutral in this dataset, but it is close to the upper end of the range where upside can start to look crowded. The Stochastic %K at 83.3 and %D at 89.0 are both in overbought territory, which usually signals that price has advanced quickly relative to its recent trading range and may be vulnerable to a pause or a brief pullback.
That combination is important: MACD says the trend remains alive, while Stochastic says the move is getting extended. When those two disagree, price often keeps rising for a while, but with more stop-start behavior and a higher chance of intraday reversals. As shown in the chart, the momentum panel is not flashing a breakdown signal; it is warning that the next leg higher may need consolidation first.
Volatility & Volume
Volatility is moderate rather than explosive. The ATR(14) at 2.65 equals about 1.7% of price, which implies the stock can still move meaningfully in a day, but not in a disorderly way. Meanwhile, the Bollinger Band width of 8.7% is described as normal, so this is not a volatility squeeze that typically precedes a sharp breakout. Instead, the key signal is that price is already trading at %B 101%, meaning it is slightly beyond the upper band. That often happens when a stock is in a strong trend, but it also means the market is paying up relative to the recent average. The message is straightforward: the trend is strong, but the band position suggests the move is extended.
Volume offers a quieter but still supportive clue. Last session volume was 9,738,890, below the 20-session average of 13,551,487, or 0.7× normal. That means the latest push higher was not powered by unusually heavy participation. In other words, the advance is being sustained, but not with the kind of volume surge that would usually confirm a decisive breakout. Even so, OBV is rising, which suggests that, over time, money flow has still been leaning into the stock rather than leaving it. The absence of heavy volume does not negate the trend; it simply makes the latest push look less emphatic than the price action alone might imply.
Key Levels & Scenarios
The immediate technical map is clear. The first level to watch is the old 20-day resistance at 157.80, now effectively converted into a reference point below the market. Above that, the stock is already flirting with the 3-month high at 158.40, and then the current price at 158.90 becomes the market’s attempt to establish acceptance above that area. On the downside, the 20-day SMA at 152.13 is the first meaningful trend marker, while the 20-day support at 147.60 is the cleaner line that would show whether buyers are still defending the recent advance. The Bollinger middle band at 152.13 reinforces that same zone as a key pivot.
If price holds above the recent high zone, the chart remains in trend-extension mode. If it slips back below the moving-average cluster, the message shifts from breakout to consolidation. If it loses the lower support, the recent rally would look much less secure.
Technical Verdict: HOLD (wait & see)
Reason 1: MACD remains positive, with the line above signal and a positive histogram, which supports the underlying uptrend.
Reason 2: Price is above the SMA20 and SMA50, and the SMA20 is still rising, confirming the trend is intact.
Reason 3: Stochastic is overbought and price is at %B 101%, so the chart looks extended even though momentum is still positive.
Verdict invalidated if price breaks below 147.60, which would mean the recent support zone has failed.
- Ideal Entry Range: 152.13 to 157.80
- Exit Target: 158.40 and above, if the stock can hold beyond the recent high zone
- Stop Loss protection: 147.60
In plain English: the trend is still up, but the stock has run far enough that the next move needs proof rather than assumption.
Latest fact: HSBC closed at 158.90 HKD, above its 3-month high of 158.40.
Summary Data HSBC
| Last price | 158.90 HKD |
| Change 1 day / 5 days / 1 month | 0.70% / 4.13% / 7.44% |
| Trend / MA-cross | uptrend / none |
| SMA20 / SMA50 | 152.13 / 146.67 |
| RSI (14) / Stochastic %K | 66.0 / 83.3 |
| Bollinger %B / ATR | 101% / 2.65 |
| Support / Resistance 20 days | 147.60 / 157.80 |
| Data as of | 21 Juli 2026 08:30 WIB |


