HSBC Testing Key Resistance: Stock Gains 4.07% (Juli 23, 2026)
On Juli 23, 2026: price 1,541.00 GBp, trend uptrend, RSI 66.3, support 1,422.60, resistance 1,509.40. technical analysis of hsbc stock.

HSBC Holdings shares rose to 1,541.00 GBp on the London Stock Exchange on 21 July 2026 at 14:00 WIB, up 4.07% on the day and extending a 1-month gain of 6.58%. The move matters because the stock is now trading above its SMA20 at 1,459.85 and above its SMA50 at 1,408.70, a setup that usually tells traders the medium-term trend is still pointing higher. But the real signal is not just that HSBC is rising — it is rising while volatility bands are narrowing, which often means the market is storing energy for a larger move rather than drifting aimlessly.
Trend & Price Action
The chart shows HSBC in a clear uptrend, with the SMA20 sloping up 0.86% over 5 days. That slope is important: it suggests the recent rally is not a one-day spike, but part of a broader advance that has been building for weeks. The share price is also sitting well above the middle Bollinger band at 1,459.85, which is another way of saying the market is trading above its recent average rather than merely bouncing around it.
At 1,541.00 GBp, HSBC is also above the upper Bollinger band at 1,508.82, with %B at 133%. In plain English, that means price has pushed beyond the upper edge of its recent statistical range. This is often a sign of strength, but it can also mean the move is stretched in the short term. The stock is trading at 136% of its 20-hour range, with 1,509.40 as the nearest resistance and 1,422.60 as support. As shown in the chart, the stock has also moved close to its 3-month high of 1,590.00, leaving less room overhead than it had earlier in the year.
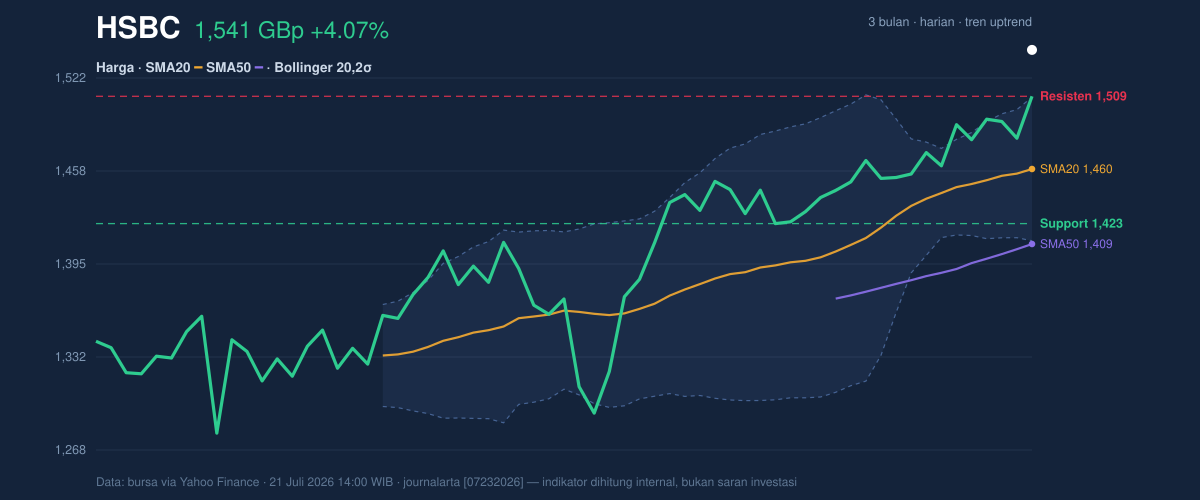
That combination — above both moving averages, above resistance, and near a 3-month high — keeps the trend constructive, but it also raises the risk of near-term consolidation.
Oscillators & Momentum
The momentum readings are supportive, but not euphoric. RSI(14) is 66.3, which sits in neutral territory but close to the overbought zone. That usually means buyers still have control, though they may be less aggressive than they were earlier in the rally. Stochastic %K at 66.4 and %D at 60.1 also points to positive momentum without the kind of extreme reading that often precedes an immediate reversal. As shown in the chart, these oscillators are aligned with the uptrend rather than fighting it.
The stronger message comes from MACD. MACD is 25.038, above the signal line at 23.444, with a positive histogram of 1.594. That matters because MACD is a trend-following momentum gauge: when the MACD line stays above the signal line and the histogram is positive, it usually means upward momentum is still expanding, even if the pace is not accelerating dramatically. In other words, the trend is alive, but the oscillators are no longer cheap.
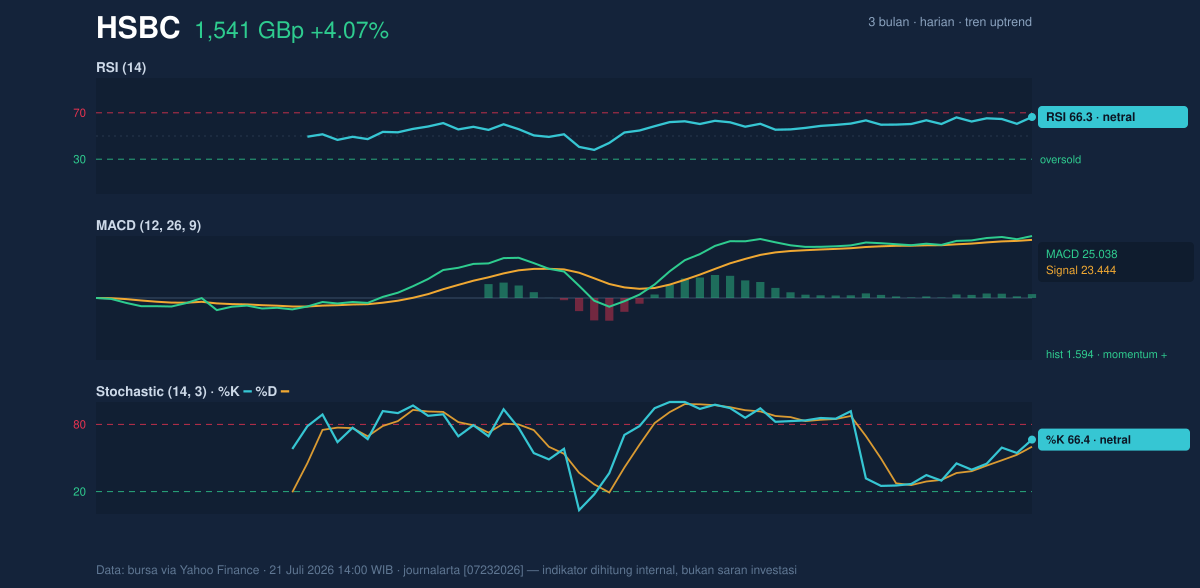
RSI is neutral, Stochastic is neutral, and MACD is positive — a combination that supports the trend without suggesting a runaway overbought condition.
Volatility & Volume
Bollinger Bands add an important layer to the story. The band width is just 6.7%, described in the data as a squeeze. A squeeze means volatility has contracted, and that often comes before a directional move. Because price is already pressing above the upper band, the market is effectively testing whether this squeeze resolves into continuation or a pause. The signal is not “calm”; it is compressed.
ATR(14) is 43.55, equal to 2.8% of price, which indicates moderate volatility. That is a useful backdrop for interpreting the current move: the stock is not in a wild, disorderly phase, but it is moving enough each day to matter. Volume, however, is a slight caution. Last volume was 14,403,876, below the 20-day average of 18,887,087, or about 0.8× normal. That means the latest rise has not yet been backed by full participation. The good news is that OBV is rising, which suggests the broader flow of money has still been accumulating despite the softer daily turnover.
In short: price is strong, volatility is compressed, but volume has not fully confirmed the breakout attempt.
Key Levels & Scenarios
The nearest technical map is straightforward. Support at 1,422.60 is the first line that matters if the rally cools. Below that, the SMA50 at 1,408.70 and the Bollinger lower band at 1,410.88 cluster in the same area, creating a deeper support zone. On the upside, resistance at 1,509.40 has already been tested by the current price, and the next visible reference is the 3-month high at 1,590.00.
The signal logic is simple. If HSBC can hold above the resistance zone and keep the MACD histogram positive, the chart remains in continuation mode. If it slips back below 1,509.40 and loses the upper-Bollinger breakout posture, that would suggest the move was a short-term extension rather than a clean step higher. If it falls through 1,422.60, the tone changes more decisively, because that would mean the market has given back the recent breakout structure and is moving back toward the mid-range.
Technical Verdict: HOLD (wait & see)
HOLD (wait & see)
- MACD is positive and above its signal line, which supports the uptrend.
- Price is above SMA20 and SMA50, confirming the broader trend remains constructive.
- Bollinger Bands are squeezing while price sits above the upper band, which can precede a breakout but also makes the move vulnerable to a pause.
Verdict invalidated if price falls below 1,422.60, because that would break the nearest support and weaken the current trend structure.
- Ideal Entry Range: 1,509.40 to 1,459.85
- Exit Target (Target Price): 1,590.00
- Stop Loss protection: 1,422.60
For non-traders, this means HSBC still looks technically strong, but the share price is stretched enough that the next move matters more than the last one.
HSBC’s 3-month high stands at 1,590.00 GBp.
Summary Data HSBC
| Last price | 1,541.00 GBp |
| Change 1 day / 5 days / 1 month | 4.07% / 3.42% / 6.58% |
| Trend / MA-cross | uptrend / none |
| SMA20 / SMA50 | 1,459.85 / 1,408.70 |
| RSI (14) / Stochastic %K | 66.3 / 66.4 |
| Bollinger %B / ATR | 133% / 43.55 |
| Support / Resistance 20 days | 1,422.60 / 1,509.40 |
| Data as of | 21 Juli 2026 14:00 WIB |


