Shell Stock Analysis: Gains 2.24%, Testing Key Resistance
On Juli 23, 2026: price 3,292.00 GBp, trend sideways, RSI 66.0, support 2,872.50, resistance 3,254.00. technical analysis of shell stock.

Shell plc climbed on the London Stock Exchange on 21 July 2026, with the shares last changing hands at 3,292.00 GBp, up 2.24% on the day and extending a 9.57% rise over one month, according to Yahoo Finance data cited by the exchange feed. The move matters because it pushed the stock above the upper Bollinger band and further beyond the short-term resistance zone, a sign that buyers are still pressing the trend even as momentum begins to look stretched.
Trend & Price Action
The broader message from the chart is not a clean breakout from a long consolidation, but a market that has been grinding higher inside a sideways structure. Shell is trading above SMA20 at 3,030.23 and above SMA50 at 3,110.89, which tells us the recent advance has enough force to keep price above both near- and medium-term averages. That is constructive, but the absence of a new MA-cross means the move is being driven more by price extension than by a fresh trend signal.
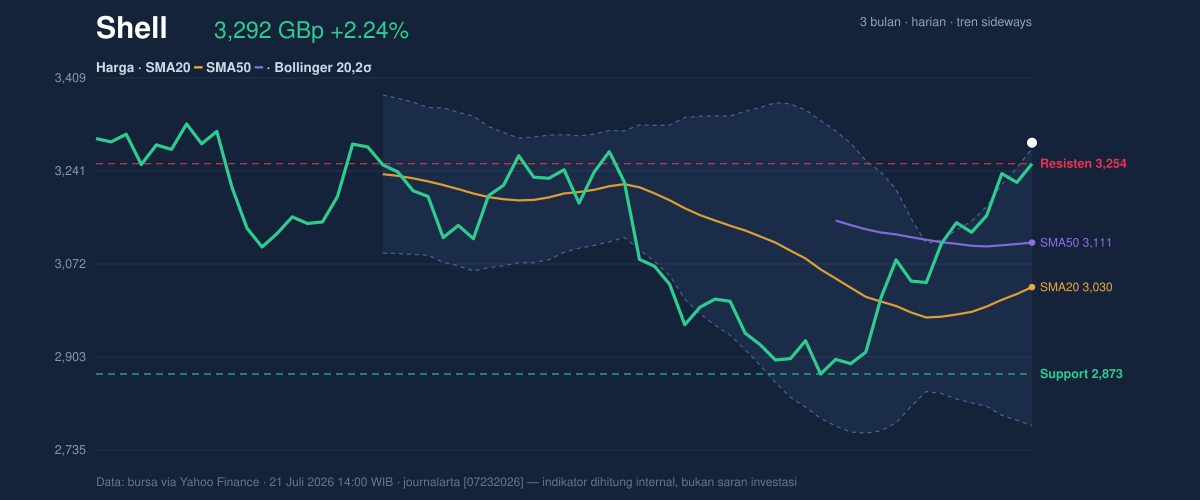
The chart also shows why this advance now needs respect rather than celebration. Shell is sitting above resistance at 3,254.00 and well above support at 2,872.50, with price positioned at 110% of the 20-hour range. In plain terms, the shares are trading near the top of the recent corridor, so the market is asking whether this is a real breakout or just a temporary overshoot. The three-month range helps frame that question: the stock is still below the 3,758.50 high, but comfortably above the 2,559.50 low, leaving room for continuation if buyers keep showing up.
Oscillators & Momentum
Momentum is strong, but not cleanly balanced. The RSI at 66.0 sits in neutral territory, which means the market is not yet in classic overbought danger on that measure alone. The Stochastic reading tells a more urgent story: %K at 97.1 and %D at 95.5 are both overbought, indicating the latest push has become very fast and may be vulnerable to a pause or pullback. That does not automatically mean reversal, but it does mean the stock is running hot.
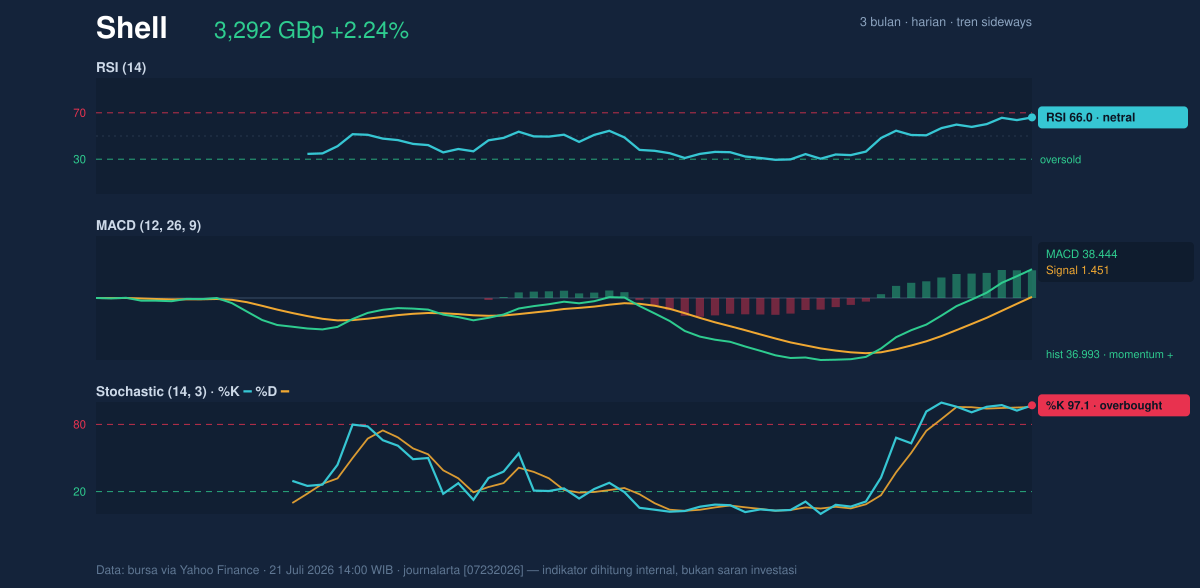
The MACD remains the clearest bullish signal in the set. With MACD at 38.444, well above the signal line at 1.451, and a histogram of 36.993, the trend impulse is still positive and broad-based. In practical terms, MACD is saying the recent price gains are not just noise; they are backed by sustained upward momentum. The tension is that the Stochastic is already flashing exhaustion while MACD is still expanding, a combination that often appears when a trend is strong but late-stage.
Volatility & Volume
Volatility is elevated, and that changes how the move should be read. The ATR at 137.00, equal to 4.2% of price, indicates that daily swings are wide enough to shake out weak holders quickly. The Bollinger setup reinforces that point: price is trading above the upper band at 3,281.18, with %B at 102%, which means the stock is not merely near the top of its recent volatility envelope but slightly outside it. That is often a sign of strength, but it can also mark the point where momentum becomes self-limiting.
The band width of 16.6% is described as normal, so this is not a volatility squeeze waiting to explode; it is more of a steady trend with a sharp extension at the edge. Volume adds a cautionary note. Last volume was 7,421,895, below the 20-day average of 9,184,314, or about 0.8× normal. That means the latest rise has not been powered by exceptional participation. The fact that OBV is rising helps offset that concern, because on-balance volume suggests money flow has still been leaning upward even without a big volume spike.
Key Levels & Scenarios
The nearest levels matter more than the broad range now. 3,254.00 is the first line the market has already exceeded, and 3,281.18 is the Bollinger ceiling that price has also pushed through. Sustained trading above those levels would tell us the breakout is being accepted, not just tested. If the stock slips back under 3,254.00, the move starts to look less like a breakout and more like a stretch. If it loses 3,030.23, the SMA20 becomes a more serious magnet for price and the recent advance would look less durable. A deeper failure below 2,872.50 would weaken the current structure materially.
Technical Verdict: HOLD (wait & see)
HOLD (wait & see)
- MACD is strongly positive, which supports the trend and argues the up-move still has momentum.
- Price is above SMA20 and SMA50, so the medium-term structure remains constructive.
- Stochastic is overbought and price is above the upper Bollinger band, which raises the risk of a near-term pause or pullback.
Verdict invalidated if price falls below 2,872.50.
- Ideal entry range: 3,030.23 to 3,254.00
- Exit target: 3,281.18 to 3,292.00
- Stop loss protection: 2,872.50
In plain English: Shell is still trending higher, but the shares now look extended, so the chart is asking for proof that this strength can hold.
“The market is still paying for the upside, but it is starting to demand evidence that the move deserves to continue.”
Summary Data Shell
| Last price | 3,292.00 GBp |
| Change 1 day / 5 days / 1 month | 2.24% / 4.61% / 9.57% |
| Trend / MA-cross | sideways / none |
| SMA20 / SMA50 | 3,030.23 / 3,110.89 |
| RSI (14) / Stochastic %K | 66.0 / 97.1 |
| Bollinger %B / ATR | 102% / 137.00 |
| Support / Resistance 20 days | 2,872.50 / 3,254.00 |
| Data as of | 21 Juli 2026 14:00 WIB |


