T Stock Gains 3.50%, Testing Key Resistance In Focus
On Juli 23, 2026: price 23.04 USD, trend sideways, RSI 60.4, support 20.48, resistance 23.04. technical analysis of t stock. Stock Gains — full details here.

AT&T shares finished at 23.04 USD on 22 July 2026, up 3.50% on the day and back to the very top of the chart’s near-term range. That matters because the stock is not just rising — it is arriving at a technical ceiling with momentum still intact, which often forces traders to decide whether the move is a breakout or just a stretch.
Trend & Price Action
The broader pattern remains sideways, but the latest push has nudged price above both the SMA20 at 21.57 and the SMA50 at 22.97. In plain terms, AT&T has moved from the middle of its recent range to the upper edge, where trend-followers usually look for confirmation rather than comfort.
The key detail is that the stock is trading above the SMA50 without a fresh moving-average crossover. That usually means the recovery is real, but not yet fully established as a new trend. The SMA20 slope of -0.34% over 5 days still points to a flat-to-soft short-term structure, so the recent strength is running against a mildly fading average rather than with a clean upward slope.
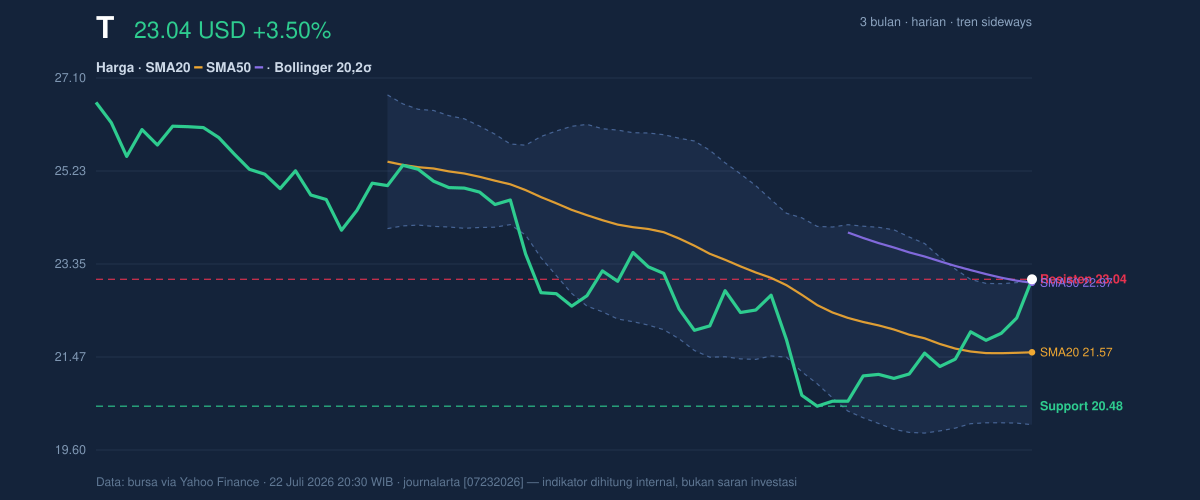
The chart also shows price sitting at 100% of the 20-hour range, with 23.04 matching the stated 20-hour resistance. That is a meaningful signal: the stock has used up the available room in the short-term band and is now testing whether buyers have enough conviction to push beyond it. The broader three-month range gives that move context. AT&T is still well below the 3-month high of 26.76, but comfortably above the 3-month low of 19.89, which keeps the story in the middle zone rather than at an extreme.
Oscillators & Momentum
Momentum is mixed, and that mix is what makes the setup interesting. The RSI at 60.4 is neutral, which means the stock is not yet in the kind of overheated territory that usually screams exhaustion. But the Stochastic %K at 83.8 and %D at 79.2 are both in overbought territory, as shown in the momentum chart, suggesting the latest move has advanced quickly relative to recent trading.
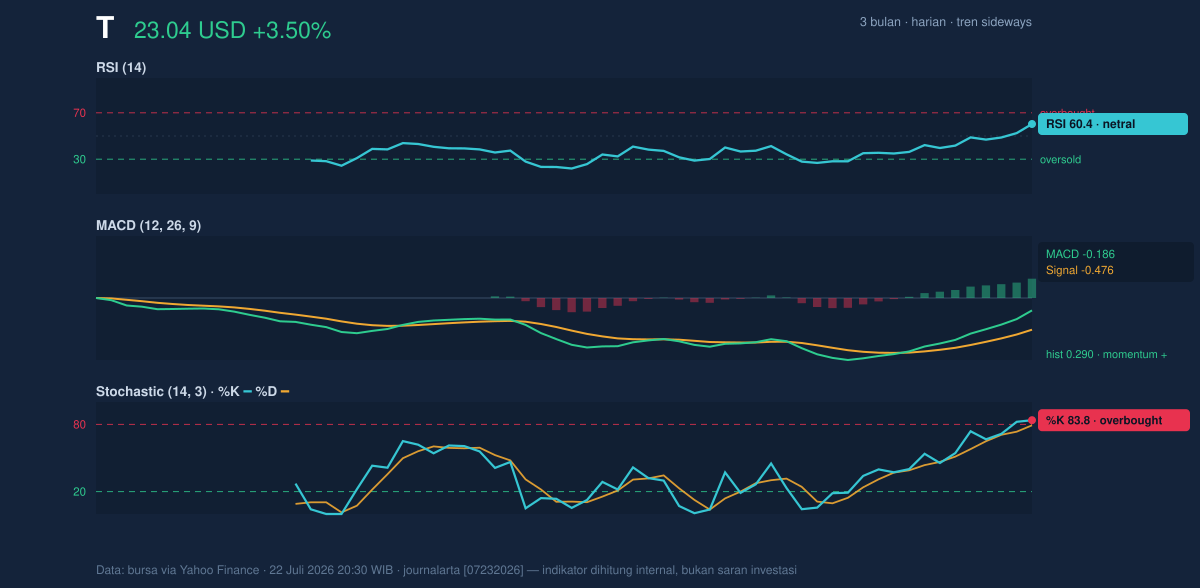
That combination matters. RSI is the slower, steadier gauge; stochastic is the faster one. When stochastic is overbought while RSI is still neutral, it often means the stock has short-term upward pressure but not necessarily a fully mature trend. In other words, AT&T may still have room to extend, but it is already trading in a zone where pauses or pullbacks become more likely.
The MACD at -0.186 with a signal line at -0.476 and a positive histogram of 0.290 adds a more constructive layer. The histogram turning positive means downside momentum has been fading and the faster line is now above the signal line. That is not a roaring bullish signal by itself, but it does show that the stock’s internal momentum has improved even while the broader trend remains sideways.
Volatility & Volume
Volatility is not elevated in a panic sense. The ATR of 0.70, equal to about 3.0% of price, suggests normal day-to-day movement rather than a disorderly swing. The Bollinger Band width of 13.5% is also described as normal, which implies the stock is not in a squeeze that usually precedes a sharp expansion, nor in an unusually wide, unstable phase.
What stands out more is where price sits inside those bands. The upper Bollinger band is 23.03, and the stock closed at 23.04 with %B at 100%. That means AT&T is pressing right against the top of its statistical envelope. When price closes at the upper band, it often signals strength — but it can also signal that the move has become extended in the short run. The message is not “overheated and doomed”; it is “strong enough to be tested.”
Volume confirms that this move has participation behind it. The latest 187,259,600 shares traded were roughly 2.1x the 20-day average of 89,346,710, and OBV is rising. That matters because rising price on heavy volume tends to be more credible than a thin advance. It suggests real engagement, not just a drift upward on low conviction.
Key Levels & Scenarios
The immediate battleground is clear. 23.04 is both the last price and the short-term resistance, while 20.48 is the nearest support from the 20-hour structure. Between those levels, the stock is effectively testing the top of the recent box.
If price can stay above 23.04, the chart would begin to shift from range-bound recovery toward a more convincing breakout attempt. If it fails to hold there, the move likely reverts toward the middle of the Bollinger structure around the SMA20 at 21.57, where the market has recently found balance.
The broader context is that AT&T is still inside the 19.89 to 26.76 three-month corridor. That leaves room both for follow-through and for mean reversion. The stock is not escaping a long-established range yet; it is probing the top of a shorter one.
Technical Verdict: HOLD (wait & see)
HOLD (wait & see)
- MACD histogram is positive, showing improving momentum, but the broader trend is still sideways.
- Stochastic is overbought while RSI remains neutral, a sign of near-term strength that may need confirmation.
- Price is at 23.04, right on resistance and the upper Bollinger band at 23.03, so the market is testing rather than confirming.
Verdict invalidated if price breaks below 20.48.
- Ideal Entry Range: 21.57 to 22.97
- Exit Target: 23.04 if the current ceiling holds; a stronger continuation would need acceptance above that level
- Stop Loss protection: 20.48
In plain English: the stock looks firmer, but it is still standing at the door rather than inside the next room.
The next clue will come from whether AT&T can hold above 23.04 while the OBV keeps rising and the MACD remains positive.
Summary Data T
| Last price | 23.04 USD |
| Change 1 day / 5 days / 1 month | 3.50% / 7.51% / 1.01% |
| Trend / MA-cross | sideways / none |
| SMA20 / SMA50 | 21.57 / 22.97 |
| RSI (14) / Stochastic %K | 60.4 / 83.8 |
| Bollinger %B / ATR | 100% / 0.70 |
| Support / Resistance 20 days | 20.48 / 23.04 |
| Data as of | 22 Juli 2026 20:30 WIB |


