VZ Stock Gains 1.16% Today, Momentum Gains
On Juli 23, 2026: price 44.29 USD, trend sideways, RSI 51.5, support 41.99, resistance 46.54. technical analysis of vz stock. VZ Stock Gains — full details…

Verizon Communications traded higher on the NYSE on 22 July 2026, with VZ last at 44.29 USD, up from the previous close of 43.78, as the stock tried to extend a short rebound inside a broader sideways pattern. The move matters less for its size than for where it sits: the shares are now above the SMA20 at 43.39 but still below the SMA50 at 45.56, which tells investors the stock has recovered from near-term weakness without yet reclaiming the longer short-term trend.
Trend & Price Action
The chart shows Verizon leaning upward in the very short term, but not enough to call it a clean trend change. The stock’s 1 day gain of 1.16% and 5 day rise of 3.41% show buyers have recently become more active, yet the 1 month change of -5.22% says the recovery is still playing catch-up after a deeper pullback.
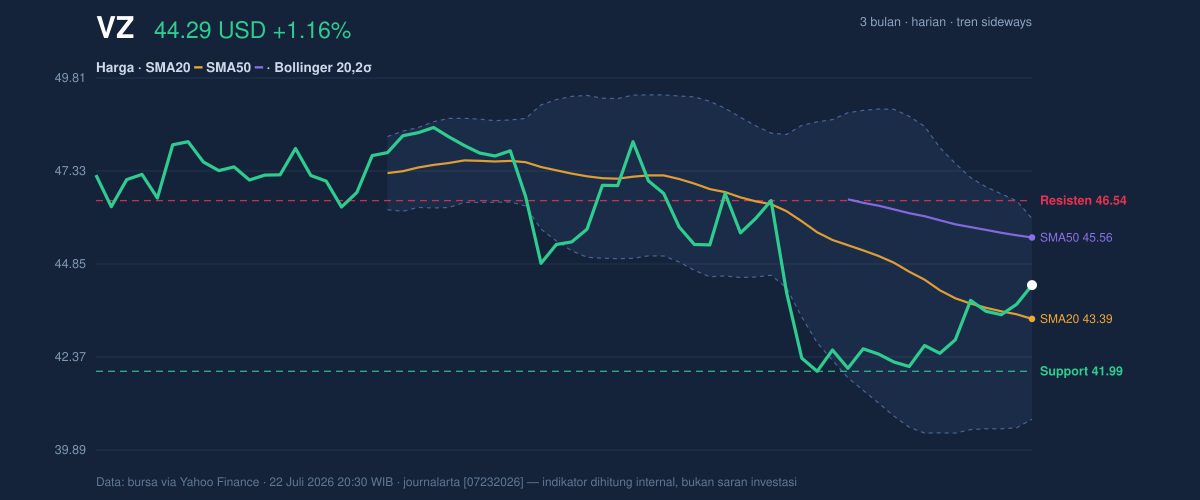
That tension is visible in the moving averages. Price above the SMA20 usually signals that the latest trading has improved relative to the recent average, while price below the SMA50 suggests the medium-term crowd has not fully returned. With the SMA20 slope at -1.25% over 5 days, the near-term average is still pointing down, so the market is not yet showing a decisive upward inflection. In plain terms, Verizon is climbing inside a range, but the range itself has not broken.
The stock is also sitting in the middle of its recent band, at 51% of the 20-hour range, between support at 41.99 and resistance at 46.54. That placement is important: prices in the middle of a range often reflect indecision rather than conviction, especially when the broader 3-month span remains bounded by a high of 48.96 and a low of 40.76. The market is still working out whether this rebound is a pause inside a larger range or the start of a more durable move.
Oscillators & Momentum
The momentum picture is mixed, which is usually the most revealing part of a stock like Verizon. The RSI at 51.5 is neutral, meaning the stock is neither stretched nor washed out. That matters because neutral RSI often leaves room for continuation if price gains traction, but it also means there is no strong momentum cushion if the move stalls.
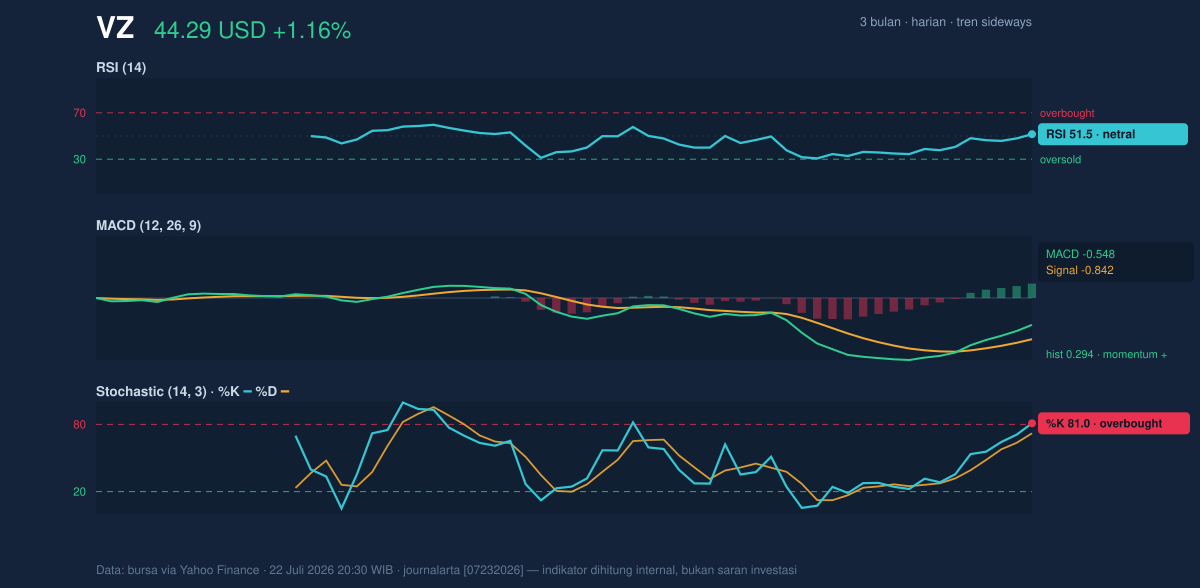
The Stochastic %K at 81.0 and %D at 72.1 are in overbought territory, which signals the latest advance may be running ahead of itself in the very short term. For general readers, “overbought” does not mean the stock must fall immediately; it means the pace of recent buying has been fast enough that some traders may start taking profits. That can cap upside unless price keeps advancing with stronger confirmation.
MACD is more constructive. The MACD at -0.548 remains below zero, so the broader momentum backdrop is still not fully bullish, but the signal line at -0.842 and histogram at 0.294 show momentum has turned positive relative to its recent baseline. In practical terms, this is an early recovery signal: the stock is still in a negative MACD environment, but the direction of change has improved. That combination often appears before a trend repair, though it can also fade if price cannot clear overhead resistance.
Volatility & Volume
Volatility is moderate rather than explosive. The ATR at 1.19, equal to 2.7% of price, suggests typical daily movement remains contained. The Bollinger Bands reinforce that view: the upper band at 46.06, middle band at 43.39, and lower band at 40.72 frame a normal 12.3% band width, not a squeeze that would usually precede a sharp breakout. The stock’s %B at 67% places price in the upper half of the band, which is constructive but not yet extreme.
Volume, however, is not confirming the move with force. Last volume of 23,732,600 was only 0.7x normal versus the 20-hour average of 33,456,635, and OBV is down. That combination matters because rising prices on lighter participation can be fragile. When volume trails and OBV falls, it often means the latest bounce is not yet being embraced by the broader market. The rally may still work, but it has not earned strong confirmation from trading activity.
Key Levels & Scenarios
The first test is the nearby resistance zone. 46.54 is the immediate ceiling from the 20-hour range, and 46.06 is the Bollinger upper band just beneath it. If Verizon pushes through that area, the chart would start to look less like a range rebound and more like an attempt to challenge the SMA50 at 45.56 decisively from above, with the 3-month high at 48.96 becoming the next visible reference point.
On the downside, 41.99 is the first support that matters, with the Bollinger lower band at 40.72 and the 3-month low at 40.76 reinforcing the same zone. If price slips back below that support, the recent bounce would lose credibility quickly because it would place the stock back near the lower end of its established range. Since the stock is already below the SMA50, failure at support would leave the market vulnerable to another rotation lower inside the sideways structure.
Technical Verdict: HOLD (wait & see)
HOLD (wait & see) fits best because the chart shows recovery, but not confirmation.
- MACD histogram positive at 0.294 suggests momentum has improved from its recent low.
- RSI at 51.5 is neutral, leaving room for either continuation or reversal.
- Stochastic at 81.0 / 72.1 is overbought, warning that the short-term bounce may be stretched.
- OBV is down and volume is only 0.7x normal, so participation is not strong enough to validate the move.
- Verdict invalidated if price falls below 41.99.
- Ideal Entry Range: 41.99 to 43.39
- Exit Target: 45.56 to 46.54
- Stop Loss protection: below 40.72
In plain English, Verizon is trying to recover, but the market has not yet shown enough strength to prove the rebound is real.
“Until volume comes back, this looks more like a cautious climb than a decisive break.”
Summary Data VZ
| Last price | 44.29 USD |
| Change 1 day / 5 days / 1 month | 1.16% / 3.41% / -5.22% |
| Trend / MA-cross | sideways / none |
| SMA20 / SMA50 | 43.39 / 45.56 |
| RSI (14) / Stochastic %K | 51.5 / 81.0 |
| Bollinger %B / ATR | 67% / 1.19 |
| Support / Resistance 20 days | 41.99 / 46.54 |
| Data as of | 22 Juli 2026 20:30 WIB |

