AIA Stock Gains 2.14%, Testing Key Resistance In Focus
On Juli 24, 2026: price 78.60 HKD, trend sideways, RSI 57.3, support 70.80, resistance 76.95. technical analysis of aia stock. AIA Stock Gains — full details…

AIA Group edged up to 78.60 HKD on 22 July 2026, extending a short run of strength after a 2.14% one-day gain and a 7.75% rise over one month, according to HKEX-linked market data via Yahoo Finance. The move matters because the share is now trading above its SMA20 at 73.78 and even above its SMA50 at 77.58, which tells traders the stock has moved from neutral drifting into a firmer short-term posture. But the signal is not cleanly bullish yet: the broader trend is still described as sideways, and the latest price sits above the upper Bollinger band at 77.40, a sign the stock has stretched ahead of its recent statistical range rather than settled into a new, orderly trend.
Trend & Price Action
As shown in the chart, the price has climbed to 78.60, placing it above both SMA20 and SMA50. That is constructive because moving averages often act as a rough map of where buyers and sellers have recently agreed on value. When price stays above them, it usually means demand is strong enough to absorb supply. The catch is that AIA has not delivered a fresh MA-cross, so there is no new moving-average signal confirming a longer trend change. In plain terms, the stock is leaning upward, but it has not yet produced the kind of crossover that would show a decisive shift in market structure.
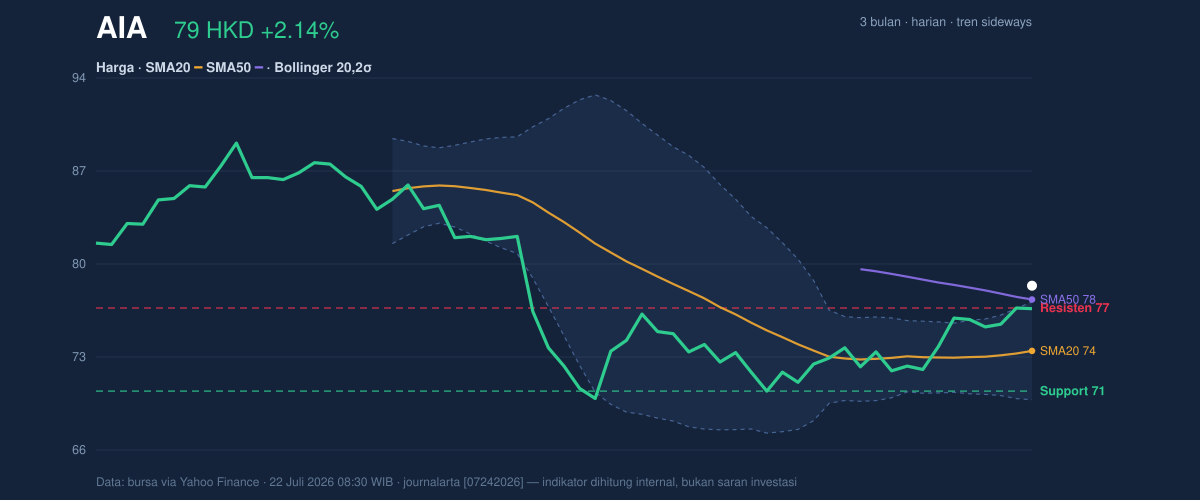
The position inside the recent trading range is also important. The stock is trading at 127% of the 20-hour range, with 20-hour resistance at 76.95 already exceeded and 20-hour support at 70.80 still well below. That means the market has pushed beyond the upper boundary of the recent range, which can signal strength, but it can also mean the move is vulnerable to a pause if momentum fades. The stock is also moving within the upper half of its 3-month range of 69.05 to 89.95, so it is not at an extreme in the wider picture.
Oscillators & Momentum
The momentum picture is mixed, and that is where the story becomes more interesting. As shown in the chart, RSI at 57.3 is still neutral. RSI measures whether gains have been too fast or too slow; a neutral reading means the advance is not yet showing the kind of exhaustion that often appears before a reversal. That said, the stochastic oscillator is much hotter: %K at 93.7 and %D at 88.7 are both in overbought territory. In simple terms, the stock has risen fast enough that it may be stretched in the very short term, even if the broader momentum is not yet damaged.
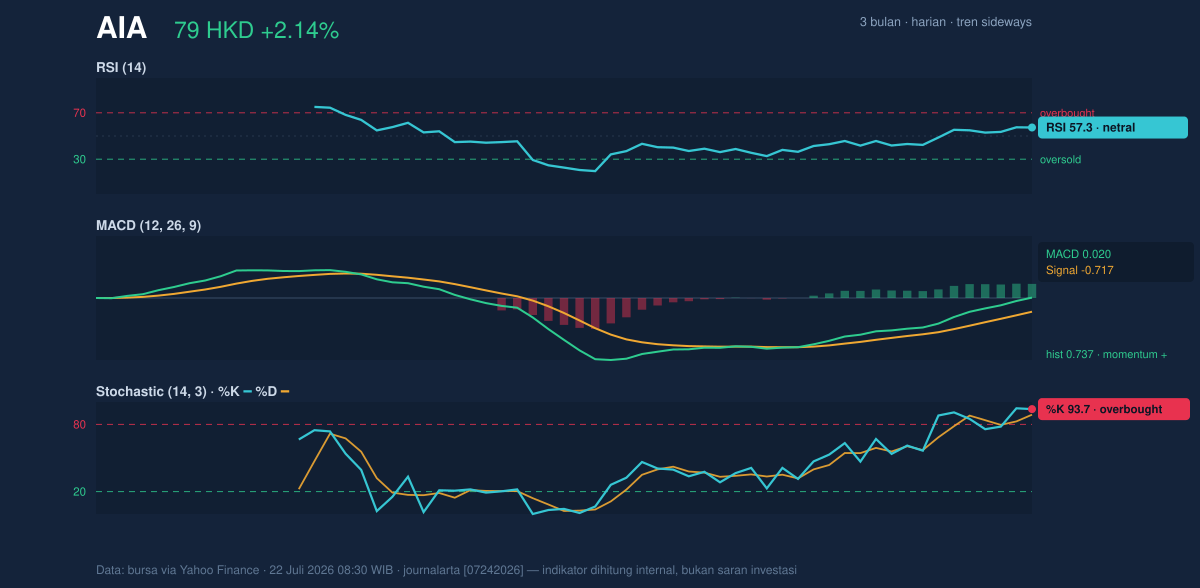
The MACD setup is the strongest bullish element in the data. MACD at 0.020 sits above the signal line at -0.717, and the histogram at 0.737 is positive. MACD compares faster and slower trend lines; when the faster line is above the slower one, it usually shows improving trend momentum. The positive histogram means that gap is widening, which suggests buyers still have control. So the oscillator set is not fully aligned: RSI says “steady,” stochastic says “stretched,” and MACD says “momentum remains positive.”
Volatility & Volume
Volatility is contained rather than explosive. ATR at 1.99, or 2.5% of price, points to moderate volatility. That means daily swings are present, but not unusually wild. Bollinger bands add another layer: the band width is 9.8%, described as normal, which suggests there is no squeeze building up a large breakout move. Yet the %B reading of 117% shows price is trading above the upper band, a classic sign of upside extension. In practical terms, the market has already used up some of its near-term upside energy, so continuation is possible, but so is a cooling-off period.
Volume does not fully confirm the move. The latest volume was 17,338,449, below the 20-session average of 26,280,371, or about 0.7× normal. That matters because price advances on lighter participation can be easier to reverse. Still, OBV is rising, which means cumulative volume flow is improving even if the latest session was not heavy. The message is subtle: the stock is attracting support over time, but the latest push higher was not accompanied by a strong burst of trading.
Key Levels & Scenarios
The nearest key levels are clear. Support at 73.78 lines up with the SMA20 and the Bollinger middle band, making it the first level where buyers have recently defended the stock. Below that, 70.80 is the next important floor from the 20-hour range. On the upside, 76.95 has already been cleared, while 77.40 marks the upper Bollinger boundary that the share has pushed through. The current price at 78.60 means the stock is trading above both of those markers, but it is also extended relative to them.
If the share holds above 77.58 and keeps MACD positive, the chart suggests the market is trying to convert a range breakout into a more durable advance. If it slips back below 73.78, the technical tone weakens quickly because that would take price back under the short-term average and the Bollinger midline. A break below 70.80 would be more serious, because it would move the stock back into the lower part of its recent trading band and undo the current breakout posture.
Technical Verdict: HOLD (wait & see)
HOLD (wait & see)
- MACD is positive, so trend momentum is still supportive.
- Price is above SMA20 and SMA50, which confirms near-term strength.
- Stochastic is overbought and %B is above 100%, showing the move is extended and vulnerable to a pause.
Verdict invalidated if price falls below 73.78, because that would break the short-term support zone and the SMA20/Bollinger midline.
- Ideal Entry Range: 73.78 to 76.95
- Exit Target: 89.95
- Stop Loss protection: 70.80
For non-traders, this means the stock looks stronger than it did a few weeks ago, but it is stretched enough that confirmation matters more than chasing the move.
Summary Data AIA
| Last price | 78.60 HKD |
| Change 1 day / 5 days / 1 month | 2.14% / 3.15% / 7.75% |
| Trend / MA-cross | sideways / none |
| SMA20 / SMA50 | 73.78 / 77.58 |
| RSI (14) / Stochastic %K | 57.3 / 93.7 |
| Bollinger %B / ATR | 117% / 1.99 |
| Support / Resistance 20 days | 70.80 / 76.95 |
| Data as of | 22 Juli 2026 08:30 WIB |


