Alibaba Stock Drops 1.79% Today, Momentum Gains
On Juli 24, 2026: price 114.90 HKD, trend sideways, RSI 55.5, support 89.50, resistance 117.00. technical analysis of alibaba stock. Alibaba Stock Drops — full…

Alibaba Group’s Hong Kong-listed shares fell to HK$114.90 on HKEX on 22 July 2026, down 1.79% from the previous close of HK$117.00, even as the stock remains up 16.12% over the past month. The move leaves the name sitting just below a near-term ceiling, with the chart showing a market that is still constructive but no longer moving in a straight line.
Trend & Price Action
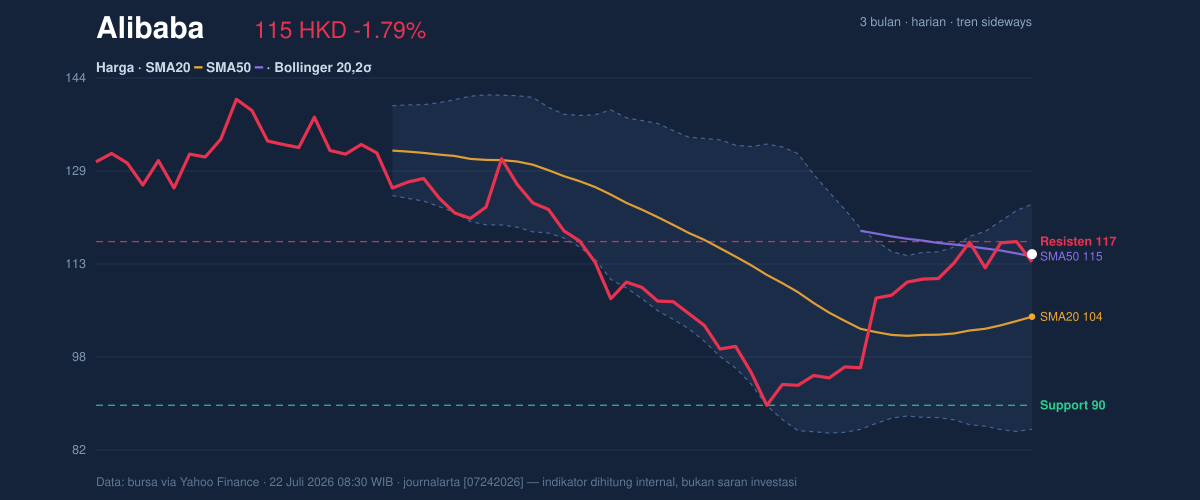
The broader setup is best described as sideways, but with a modest upward lean: the SMA20 at HK$104.38 is rising, and the price is still trading above the SMA20. That matters because it tells readers the recent pullback has not yet broken the shorter-term trend structure. At the same time, the stock is only slightly above the SMA50 at HK$114.51, which makes this area important: it is acting as a line where buyers and sellers are currently balancing each other. There is no new MA cross, so the chart has not produced a fresh trend signal from the moving averages. As shown in the chart, Alibaba is also trading near the top of its recent range, with support at HK$89.50 and resistance at HK$117.00, and the price sitting at 92% of that range. That positioning usually means the market is close to testing whether the latest rally has enough strength to extend, or whether it needs to cool off first.
A short pause here matters.
The stock is not far from resistance, but it is also not stretched far above its average trend lines.
Oscillators & Momentum
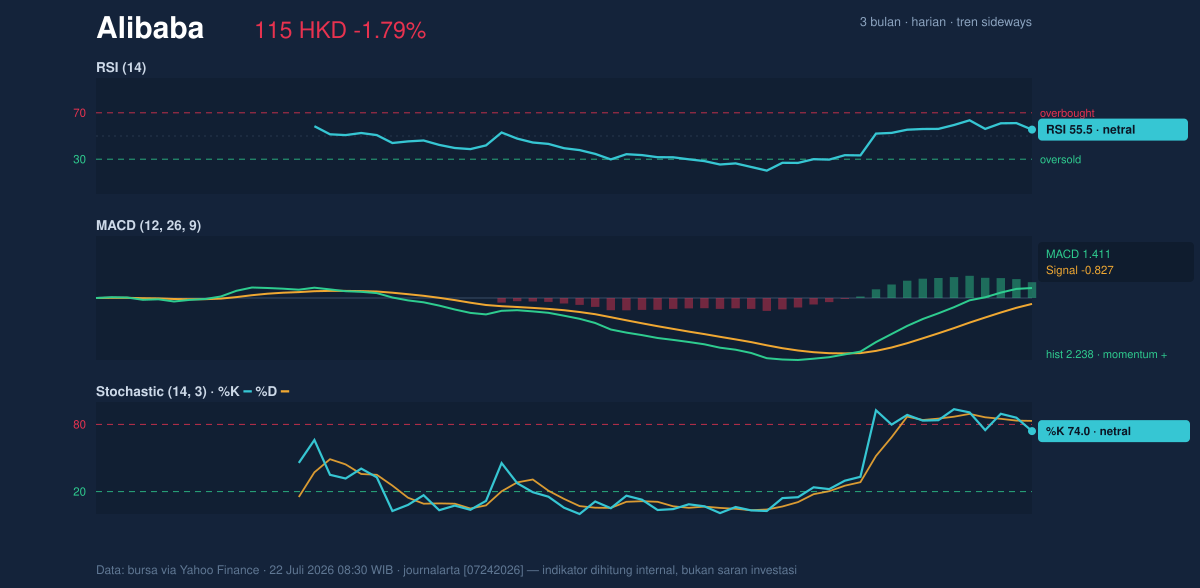
Momentum indicators are mixed, which is often what a maturing rally looks like. The RSI(14) at 55.5 is neutral, meaning the shares are neither clearly overbought nor oversold. That is important because it suggests the recent rise has not yet reached an extreme that would normally force a sharp reversal. The Stochastic %K at 74.0 and %D at 83.2 is also neutral, though the readings are close enough to the upper zone to indicate the stock has been trading with some near-term strength. In plain language, the oscillator is saying Alibaba has momentum, but not the kind that screams overheating. The most encouraging signal comes from the trend-following side: MACD at 1.411 versus a signal line at -0.827, with a histogram of 2.238, points to positive momentum still being in force. The histogram is especially useful because it shows the gap between the MACD line and its signal line; a positive reading means buying pressure is still dominating the recent trend. In other words, the chart says the stock has not lost its upward bias, even if the pace has become less one-directional.
The message is simple: momentum is supportive, but not euphoric.
Volatility & Volume
Volatility is clearly elevated. The Bollinger Bands are wide, with the upper band at HK$123.28 and the lower band at HK$85.48, while the 36.2% band width and ATR(14) of HK$5.87 — equal to 5.1% of price — both indicate a market capable of larger daily swings. For readers, ATR is a gauge of typical daily movement: a higher figure means the stock can travel farther in either direction before settling. The current %B of 78% means the price is trading in the upper part of the Bollinger envelope, which usually signals strength, but also means less room before the upper band becomes the next test. Volume adds a useful confirmation: last trade volume of 120,611,396 was close to the 20-day average of 125,163,505, or about 1.0× normal. That tells us the latest move is not being driven by a dramatic surge in participation, but neither is it collapsing on weak trading. Meanwhile, OBV is rising, which suggests that, over time, more volume has been flowing into up days than down days. That is a constructive sign because it implies accumulation rather than distribution.
Key Levels & Scenarios
The immediate battleground is clear. HK$117.00 is the first resistance to watch, and it also doubles as the recent close reference. If Alibaba can move through that level with follow-through, the chart would shift toward a test of the HK$123.28 upper Bollinger band, where momentum traders often look for the next checkpoint. On the downside, the first meaningful support is the SMA50 at HK$114.51, closely followed by the SMA20 at HK$104.38. A break beneath the SMA50 would suggest the latest lift is losing traction and that the stock may need to revisit the mid-band area before any new push higher. Below that, the broader support zone around HK$89.50 becomes the deeper structural floor, with the 3-month low at HK$88.65 marking the lower edge of the recent trading box. Given the current placement near the top of the range, the chart is asking a straightforward question: can the stock turn resistance into support, or does it slip back toward the moving averages first?
Technical Verdict: HOLD (wait & see)
HOLD (wait & see) fits the chart because the stock has positive momentum, but it is also pressing into resistance with no fresh moving-average crossover to confirm a new trend phase.
- MACD remains positive, with a 2.238 histogram, showing momentum is still supportive.
- RSI 55.5 and Stochastic %K 74.0 / %D 83.2 are neutral, so the stock is not yet in an extreme that would force a directional call.
- Price is near resistance at HK$117.00 and the Bollinger bands are wide, which raises the chance of a larger swing but not necessarily an immediate breakout.
Verdict invalidated if price falls below HK$114.51, where the SMA50 sits and near-term trend support would be tested.
- Ideal Entry Range: HK$104.38 to HK$114.51
- Exit Target: HK$117.00, then HK$123.28
- Stop Loss protection: below HK$89.50
For non-traders, this means the chart still leans positive, but it is waiting for a cleaner signal before the next directional move.
Alibaba’s 3-month high is HK$144.00.
Summary Data Alibaba
| Last price | 114.90 HKD |
| Change 1 day / 5 days / 1 month | -1.79% / 1.32% / 16.12% |
| Trend / MA-cross | sideways / none |
| SMA20 / SMA50 | 104.38 / 114.51 |
| RSI (14) / Stochastic %K | 55.5 / 74.0 |
| Bollinger %B / ATR | 78% / 5.87 |
| Support / Resistance 20 days | 89.50 / 117.00 |
| Data as of | 22 Juli 2026 08:30 WIB |



