BP Stock Gains 5.03% Today, Testing Key Resistance
On Juli 24, 2026: price 555.90 GBp, trend sideways, RSI 65.7, support 455.60, resistance 539.30. technical analysis of bp stock. BP Stock Gains — full details…

International investors are watching BP plc’s London line press into fresh technical territory while the broader signal set says the move is strong, but stretched. The shares closed at 555.90 GBp on the LSE, up 5.03% on the day and 15.80% over one month, according to exchange data cited via Yahoo Finance on 22 July 2026 at 14:00 WIB. That is a meaningful break above the recent trading band, yet the chart is also flashing signs that momentum may be running ahead of short-term confirmation.
Trend & Price Action
The first thing that stands out on the chart is location: BP is trading above its SMA20 at 491.11 and also above the SMA50 at 515.37. For non-specialists, a simple moving average is the average price over a set period; when price sits above both, it usually means the market has shifted into a firmer short-term posture. The catch is that the stock is still described as sideways, with the SMA20 slope at 1.50% over 5 days. That matters because it suggests the recent rise is improving the trend, but not yet enough to call it a clean, sustained breakout.
The share price is also trading well beyond the 20-hour resistance at 539.30, and even above the upper Bollinger band at 539.90. As shown in the chart, that places BP at 120% of its 20-hour range, which is a sign of strength but also of extension. In practical terms, buyers have been willing to pay up aggressively, but when price pushes beyond the upper band, the market is often telling you the move is fast rather than comfortable.
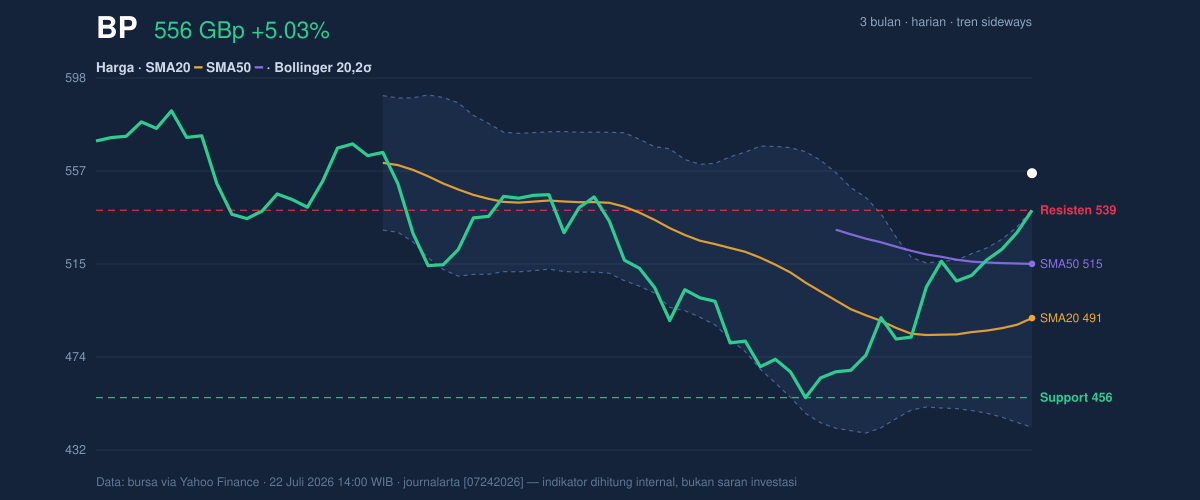
The broader range helps frame the move. BP is now closer to the 3-month high of 592.00 than the 3-month low of 450.60, which confirms the recovery has room to run before it meets the top of that range again. Still, the distance from the upper Bollinger band and the recent resistance suggests the stock may need a pause before it can build a more durable base at these levels.
Oscillators & Momentum
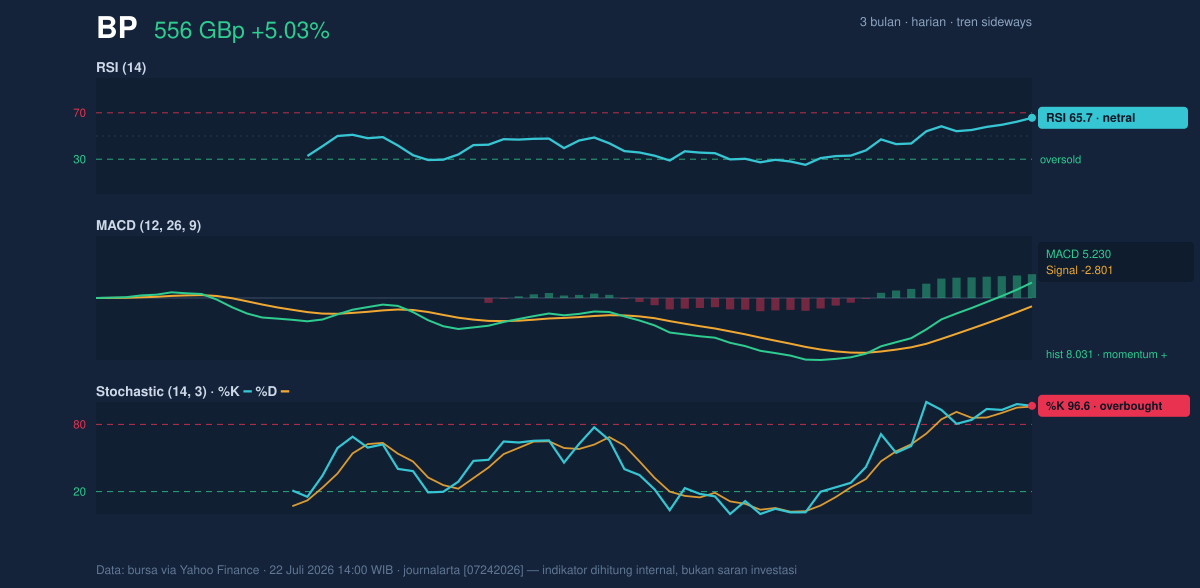
Momentum is where the picture becomes more nuanced. The RSI at 65.7 is described as neutral, which means the stock is not yet in a classic overbought danger zone on this measure alone. RSI, or relative strength index, tracks how fast and how far price has moved; readings near 70 are often treated as stretched, so 65.7 is elevated but not extreme.
The Stochastic oscillator is much hotter, with %K at 96.6 and %D at 95.9. That is firmly overbought and signals price is closing near the top of its recent range. This does not automatically mean reversal, but it does mean the stock is vulnerable to a pullback if buyers fail to keep pressing. In other words, the market is no longer cheap on a short-term basis.
The MACD is positive at 5.230, above its signal line at -2.801, with a histogram of 8.031. MACD measures trend momentum; when it stays above the signal line and the histogram is positive, it usually confirms that the trend has upside energy. Here, that positive reading is important because it offsets the overbought Stochastic warning. The chart therefore shows a market that is technically strong but short-term stretched rather than one that has already rolled over.
Volatility & Volume
Volatility is not exploding. The ATR(14) at 12.48, equal to 2.2% of price, points to moderate volatility. ATR, or average true range, is a way of measuring how much a share typically moves in a day; at this level, BP is active but not disorderly. That matters because it suggests the latest jump is not just noise from a thin market.
Volume, however, adds a cautionary note. The latest turnover was 28,971,893, below the 20-hour average of 38,908,436, or about 0.7× normal. Price rising on lighter volume can still work, but it often means conviction is less broad than the headline move suggests. The good news is that OBV is rising, which indicates cumulative buying pressure has been improving even if the latest session did not come with full participation. That combination usually means the advance has support, but not yet the sort of broad-backed volume that tends to sustain a breakout cleanly.
Key Levels & Scenarios
The nearest technical floor is the 20-hour support at 455.60, with the SMA20 at 491.11 and SMA50 at 515.37 now acting as layered reference points underneath the market. Those levels matter because they show where the prior downtrend has been absorbed and where buyers may reappear if the stock cools off.
On the upside, the immediate level to watch is the 20-hour resistance at 539.30, which BP has already cleared, followed by the upper Bollinger band at 539.90. A move that holds above those markers would reinforce the idea that the market has transitioned from range trading into a stronger phase. If price slips back below those levels, the move starts to look more like an overextension than a breakout.
The cleanest read from the chart is therefore conditional: if BP can remain above the recent resistance zone, the market keeps the benefit of the doubt; if it loses that zone and drifts back toward the moving averages, the overbought Stochastic warning becomes more important.
Technical Verdict: HOLD (wait & see)
HOLD (wait & see)
- MACD is positive, which supports the current up-move and shows momentum remains constructive.
- Price is above SMA20 and SMA50, confirming the shares have improved technically versus the recent trend.
- Stochastic is overbought and price is above the upper Bollinger band, which suggests the rally is extended and may need consolidation.
Verdict invalidated if price falls below 539.30, because that would mean the breakout above near-term resistance has failed.
- Ideal entry range: 539.30 to 555.90 GBp
- Exit target: 592.00 GBp
- Stop loss protection: 515.37 GBp
In plain English: BP’s chart looks stronger than it did a few weeks ago, but the latest jump is already stretched enough that the next move matters more than the last one.
Summary Data BP
| Last price | 555.90 GBp |
| Change 1 day / 5 days / 1 month | 5.03% / 9.49% / 15.80% |
| Trend / MA-cross | sideways / none |
| SMA20 / SMA50 | 491.11 / 515.37 |
| RSI (14) / Stochastic %K | 65.7 / 96.6 |
| Bollinger %B / ATR | 116% / 12.48 |
| Support / Resistance 20 days | 455.60 / 539.30 |
| Data as of | 22 Juli 2026 14:00 WIB |


