DBS RSI Overbought: Stock Gains 2.08% (Juli 24, 2026)
On Juli 24, 2026: price 73.50 SGD, trend uptrend, RSI 80.2, support 65.40, resistance 73.66. technical analysis of dbs stock. DBS RSI Overbought — full details…

DBS Group ended at SGD 73.50, up 2.08% on the day and now sitting just below a 20-day resistance at SGD 73.66, according to data from SGX via Yahoo Finance on 22 July 2026, 08:00 WIB. The move matters because it comes with a price that is already above the short- and medium-term trend lines — SMA20 at SGD 69.23 and SMA50 at SGD 65.57 — while volume jumped to 6,445,900, or 1.6× the 20-day average. That combination usually signals not just a drift higher, but active participation behind the move. At the same time, the stock is now stretched: momentum gauges are flashing overbought, which means the rally has been strong enough to raise the odds of a pause or pullback.
Trend & Price Action
The broader structure remains constructive. DBS is in an uptrend, with the SMA20 rising at 2.31% over 5 days, a sign that the short-term trend is still climbing rather than flattening out. Price is trading above the SMA20 and SMA50, which tells readers the market is still pricing DBS above its recent and intermediate averages. In plain English, that usually means buyers have been willing to pay progressively higher prices, and the trend has not yet lost its footing.
The stock is also trading near the top of its recent range. As shown in the chart, DBS is at 98% of its 20-day range, with support at SGD 65.40 and resistance at SGD 73.66. That is important because the closer a stock gets to the top of a range, the more the market asks a simple question: can it break higher, or is it running into a ceiling? The answer is not yet clear, but the fact that the price is only SGD 0.16 below resistance suggests the market is testing that ceiling rather than retreating from it.
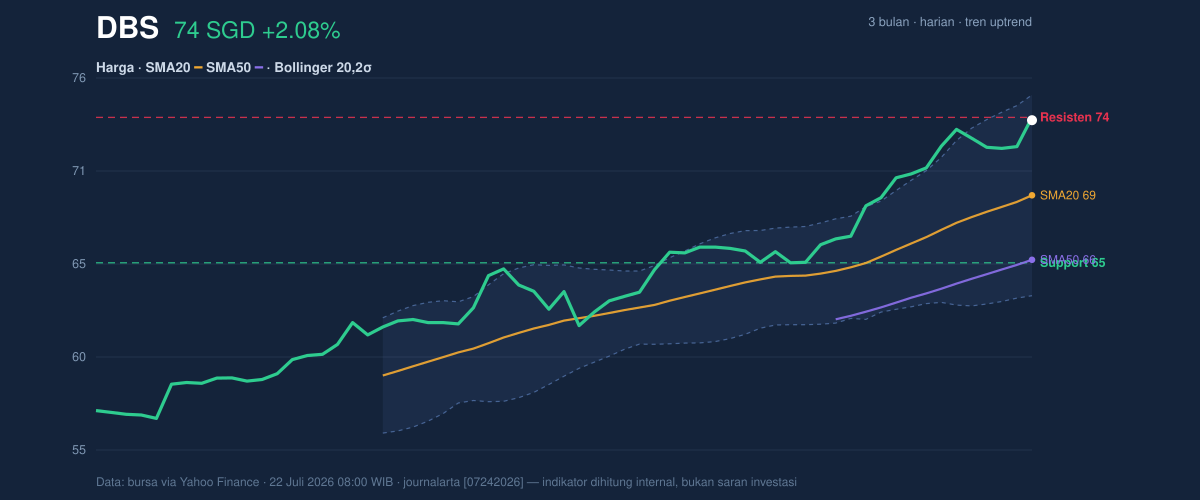
There is also a broader marker worth noting: the 3-month high is SGD 73.66, exactly where current resistance sits, while the 3-month low is SGD 56.56. That alignment tells us the stock has already recovered a large part of its recent trading band, and the next move is likely to be judged by whether it can convert that high into support. If it cannot, the chart may simply be showing exhaustion after a strong run.
Oscillators & Momentum
The momentum picture is strong, but increasingly stretched. The RSI(14) is 80.2, which is firmly in overbought territory. That does not mean the price must fall immediately; it means the rally has been fast enough that the market may be more vulnerable to consolidation. The Stochastic %K at 100.0 and %D at 86.9 reinforce that message: the stock is pressing the upper edge of its recent trading window, and short-term enthusiasm is running hot.
At the same time, the trend is still backed by the MACD. The MACD at 2.259 remains above the signal line at 2.069, with a positive histogram of 0.190. That matters because MACD is a trend-following indicator: when it stays above the signal line, it usually says the underlying move still has momentum. In this case, the oscillators are not disagreeing with the trend — they are simply warning that the trend may be extended rather than fresh.
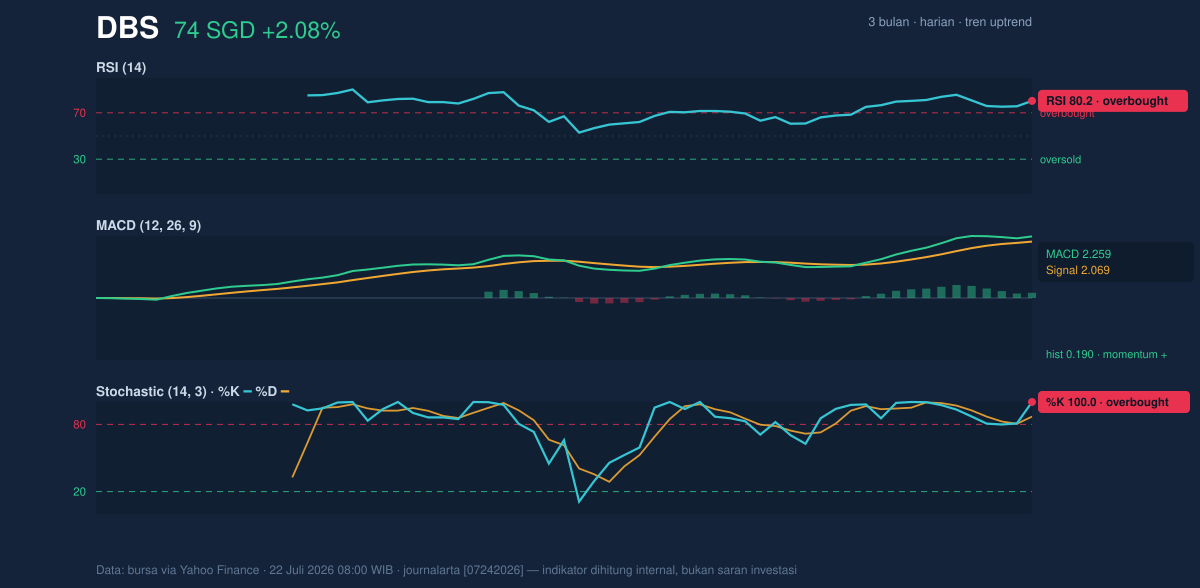
This is the key tension in the chart: RSI and Stochastic are overbought, but MACD remains positive. That mix often appears when a stock is still rising, yet the pace of the rise is getting harder to sustain. Traders watching the chart will be looking for whether the next sessions bring a brief reset in momentum or a clean breakout above resistance.
Volatility & Volume
Volatility is present, but not extreme. The Bollinger Bands show the upper band at SGD 74.94, the middle band at SGD 69.23, and the lower band at SGD 63.53. With %B at 87%, price is trading near the upper band, which usually signals a strong trend but also a market that may be leaning too far to one side in the short term. The band width of 16.5% is described as normal, so this is not a volatility breakout regime yet; instead, the stock is moving within a regular range while pressing against the top of that range.
That makes the volume spike more meaningful. A rise to 1.6× the 20-day average, alongside OBV rising, suggests buyers are not merely marking time — they are showing up in size. OBV, or on-balance volume, tracks whether volume is flowing into the stock on up days or out of it on down days. A rising OBV here supports the idea that the latest advance has real participation behind it.
Still, the ATR(14) at 1.22, or 1.7% of price, says the stock is moving with moderate day-to-day range. That means DBS is not in a disorderly swing environment, but it is moving enough that a break above resistance or a slip back toward support could happen quickly once one side gains control.
Key Levels & Scenarios
As shown in the chart, the market is being compressed between a nearby ceiling and a distant floor. The immediate battleground is SGD 73.66 resistance. A sustained move above that level would matter because it would put DBS into price discovery above its 3-month high, with the upper Bollinger band at SGD 74.94 acting as the next technical reference. On the downside, the first meaningful cushion is SGD 69.23, the SMA20 and Bollinger middle band, which often acts as a trend line for short-term buyers. Below that, the deeper support sits at SGD 65.40.
If the stock fails to hold the area around SGD 73.66, the overbought readings would become more important, because a rejection there would suggest the rally has outrun itself. If it breaks above that level and holds, the message would be different: the market would be confirming that strong volume and positive MACD are still overpowering the stretched oscillators.
Technical Verdict: HOLD (wait & see)
- RSI at 80.2 and Stochastic %K at 100.0 show the stock is overbought, so the rally looks extended.
- MACD at 2.259 above signal 2.069 and OBV rising show trend and participation are still supportive.
- Price at SGD 73.50 is sitting just under SGD 73.66 resistance, making the next move decisive but not yet confirmed.
Verdict invalidated if price falls below SGD 69.23, because that would mean the stock has lost its short-term trend base at the SMA20 and Bollinger middle band.
Ideal Entry Range: SGD 69.23 to SGD 73.66
Exit Target: SGD 74.94
Stop Loss Protection: SGD 65.40
For non-traders, this means DBS is still strong, but it is now close enough to resistance that the market needs to prove the rally has more room left.
“The next move will tell us whether this is a breakout or just a very full tank.”
Summary Data DBS
| Last price | 73.50 SGD |
| Change 1 day / 5 days / 1 month | 2.08% / 0.71% / 10.99% |
| Trend / MA-cross | uptrend / none |
| SMA20 / SMA50 | 69.23 / 65.57 |
| RSI (14) / Stochastic %K | 80.2 / 100.0 |
| Bollinger %B / ATR | 87% / 1.22 |
| Support / Resistance 20 days | 65.40 / 73.66 |
| Data as of | 22 Juli 2026 08:00 WIB |

