On Juli 24, 2026: price 1,527.00 GBp, trend uptrend, RSI 71.3, support 1,422.60, resistance 1,541.00. technical analysis of hsbc stock.
By Elena Vance
July 24, 20265 min read
HSBC Stock Analysis: Gains 1.17%, RSI Overbought
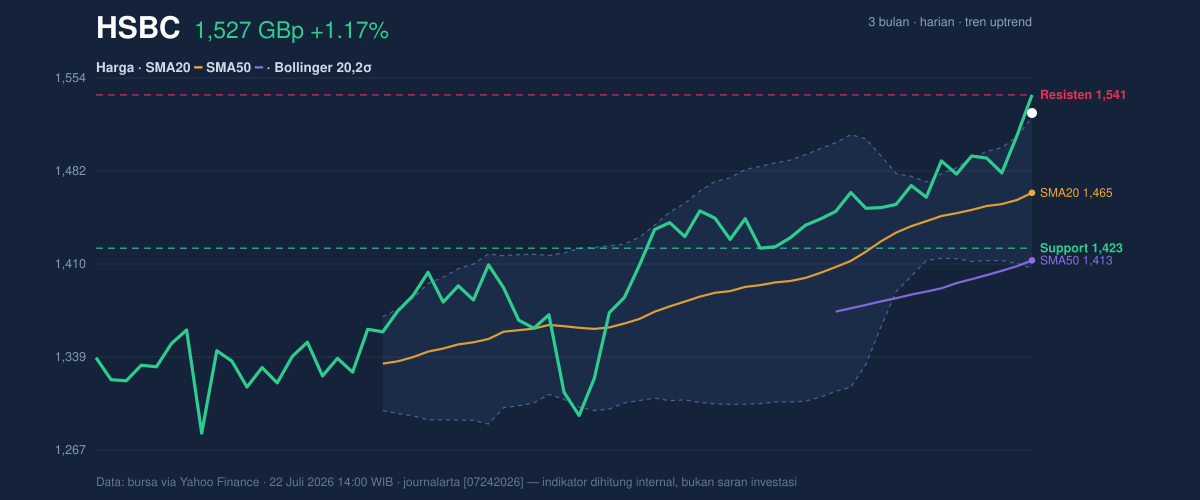
HSBC Holdings finished at 1,527.00 GBp on the LSE, up 1.17% on the day and extending its 1-month gain of 6.83%, with the shares now trading above both the SMA20 at 1,465.43 and the SMA50 at 1,413.15. That matters because it shows the market is still paying up for the stock’s recent trend, but it is also leaning into a technically stretched setup: the price is already above the upper Bollinger band at 1,523.78, while momentum gauges are split between strength and fatigue.
Trend & Price Action
HSBC’s chart is still pointing higher. The stock is in an uptrend, and the SMA20 slope of 1.09% over 5 days shows the short-term trend is not just positive, but accelerating. Trading above the SMA20 and SMA50 typically means buyers have been willing to absorb supply on dips, rather than waiting for cheaper levels. The absence of a fresh MA-cross means this is not a brand-new trend signal; instead, it is a continuation phase, where the market is trying to extend an already-established move.
The price is also sitting near the top of its recent range. With the stock at 88% of the 20-hour range between 1,422.60 support and 1,541.00 resistance, the market is pressing into the upper boundary rather than consolidating in the middle. As shown in the chart, that usually signals confidence, but it also leaves less room for error if momentum cools.
3-month price action chart of HSBC: price, SMA20/50, Bollinger, support & resistance. Data: exchange via Yahoo Finance.
A short move above resistance would matter more than a slow grind inside the range.
Oscillators & Momentum
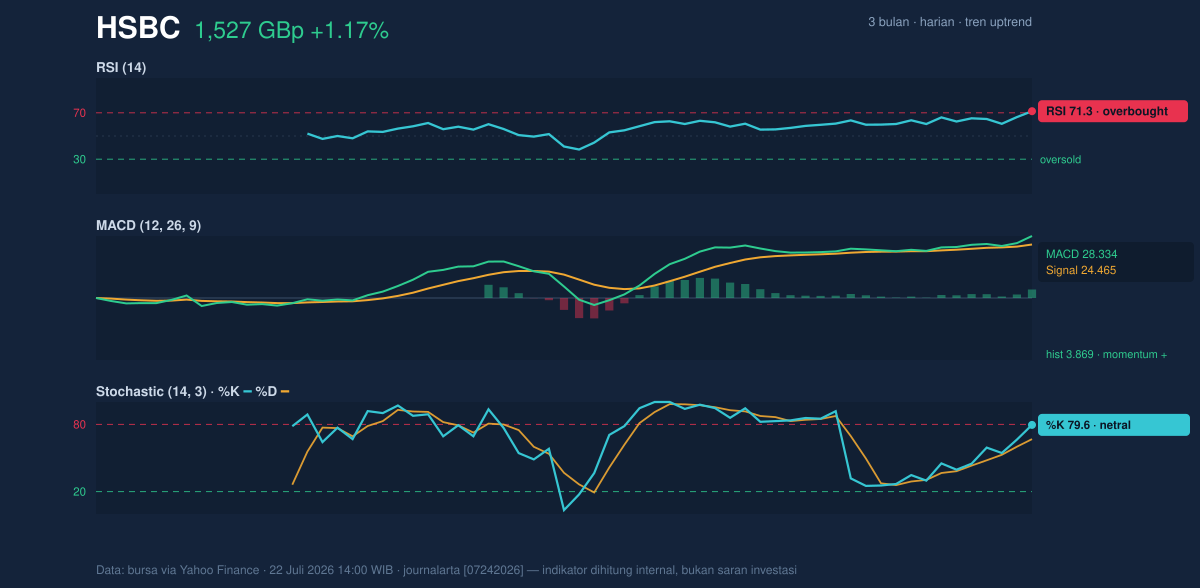
The momentum picture is constructive, but not clean. The MACD at 28.334 is above its signal line at 24.465, with a positive histogram of 3.869. In plain English, that means the trend is still gaining force: the faster-moving average used in MACD is outrunning the slower one, which usually confirms buying pressure. That is the clearest bullish signal in the set.
But the RSI at 71.3 is already in overbought territory. Overbought does not mean the shares must fall; it means the rally has moved far enough, fast enough, that the market may be vulnerable to pauses or profit-taking. The Stochastic %K at 79.6 and %D at 66.8 are more neutral than alarming, suggesting the stock is not yet flashing a full reversal warning. Put together, the oscillators say the trend is still alive, but the easy part of the move may already be behind it.
Advertisement
Momentum chart of HSBC: RSI(14), MACD, Stochastic. Data: exchange via Yahoo Finance.
That mix — strong MACD, stretched RSI — is the classic sign of a trend that is healthy, but no longer cheap.
Volatility & Volume
The Bollinger structure adds an important nuance. The band width is just 8.0%, described here as a squeeze, which means volatility has been compressing. When price pushes beyond the upper band while the bands are tight, markets often prepare for a sharper move rather than a gentle one. The catch is that the direction is not guaranteed; squeezes can resolve either way. In HSBC’s case, the fact that price is already above the upper band and %B is 103% shows the shares are trading beyond the normal statistical envelope, which is a sign of strength but also a warning that momentum is extended.
ATR helps frame what “extended” might feel like in practice. The ATR(14) of 43.35, equal to 2.8% of price, indicates moderate volatility. That is enough to produce meaningful intraday swings, but not so high that the chart is in disorder. Volume was almost exactly normal at 1.0× the 20-hour average, and OBV is rising, which matters because it suggests buyers are still participating rather than just chasing a thin move. Rising OBV alongside a higher price is the kind of confirmation traders look for when they want to know whether the advance has real sponsorship.
Key Levels & Scenarios
The immediate battleground is clear. Resistance at 1,541.00 is the first level the market must clear to keep the breakout narrative intact, while support at 1,422.60 is the main floor if the rally loses momentum. The SMA20 at 1,465.43 sits in between and acts as a practical trend gauge: staying above it suggests the short-term uptrend remains intact, while a move back through it would tell you the recent breakout has started to fade.
If the shares can hold above the upper Bollinger band and push through 1,541.00, the chart would be signaling continuation rather than exhaustion. If price slips back inside the band and then loses 1,465.43, the message changes quickly: the market would be showing that the breakout was not yet strong enough to sustain itself. The 3-month high of 1,590.00 is the next obvious reference point on the upside, while the 3-month low of 1,256.20 marks the broader downside anchor for the trend.
Technical Verdict: HOLD (wait & see)
The setup is still constructive, but the chart is no longer offering a clean entry after a strong run. HOLD (wait & see) fits best because the trend is positive, yet the RSI at 71.3 is overbought and price is already above the upper Bollinger band at 1,523.78, which increases the risk of a pause. The MACD remains positive, and OBV is rising, so there is no sign of broad distribution yet. The verdict is invalidated if price falls below 1,422.60, because that would break the nearest support and weaken the current trend structure.
Advertisement
Ideal Entry Range: 1,465.43 to 1,422.60
Exit Target: 1,541.00, then 1,590.00
Stop Loss protection: below 1,422.60
For non-traders, this means HSBC’s shares still look strong, but they are already stretched enough that patience matters more than chasing the move.
The latest 20-hour resistance level is 1,541.00.